SCENT COMMONS / V121 STUDY / V122 PUBLICATION / 10 NOVEMBER 2026
Learn the exposure.
Propose a setting. Check it.
Simulation data trained ML to predict exposure at each seat. ML chose five new ventilation settings, and the original simulator checked every one. The result is a tested design-preview tool for two fixed rooms.
The five proposals are closely related and none beats the previous best setting. This is evidence of a working, accurate preview within the tested model, with no new optimisation advantage or physical validation established.
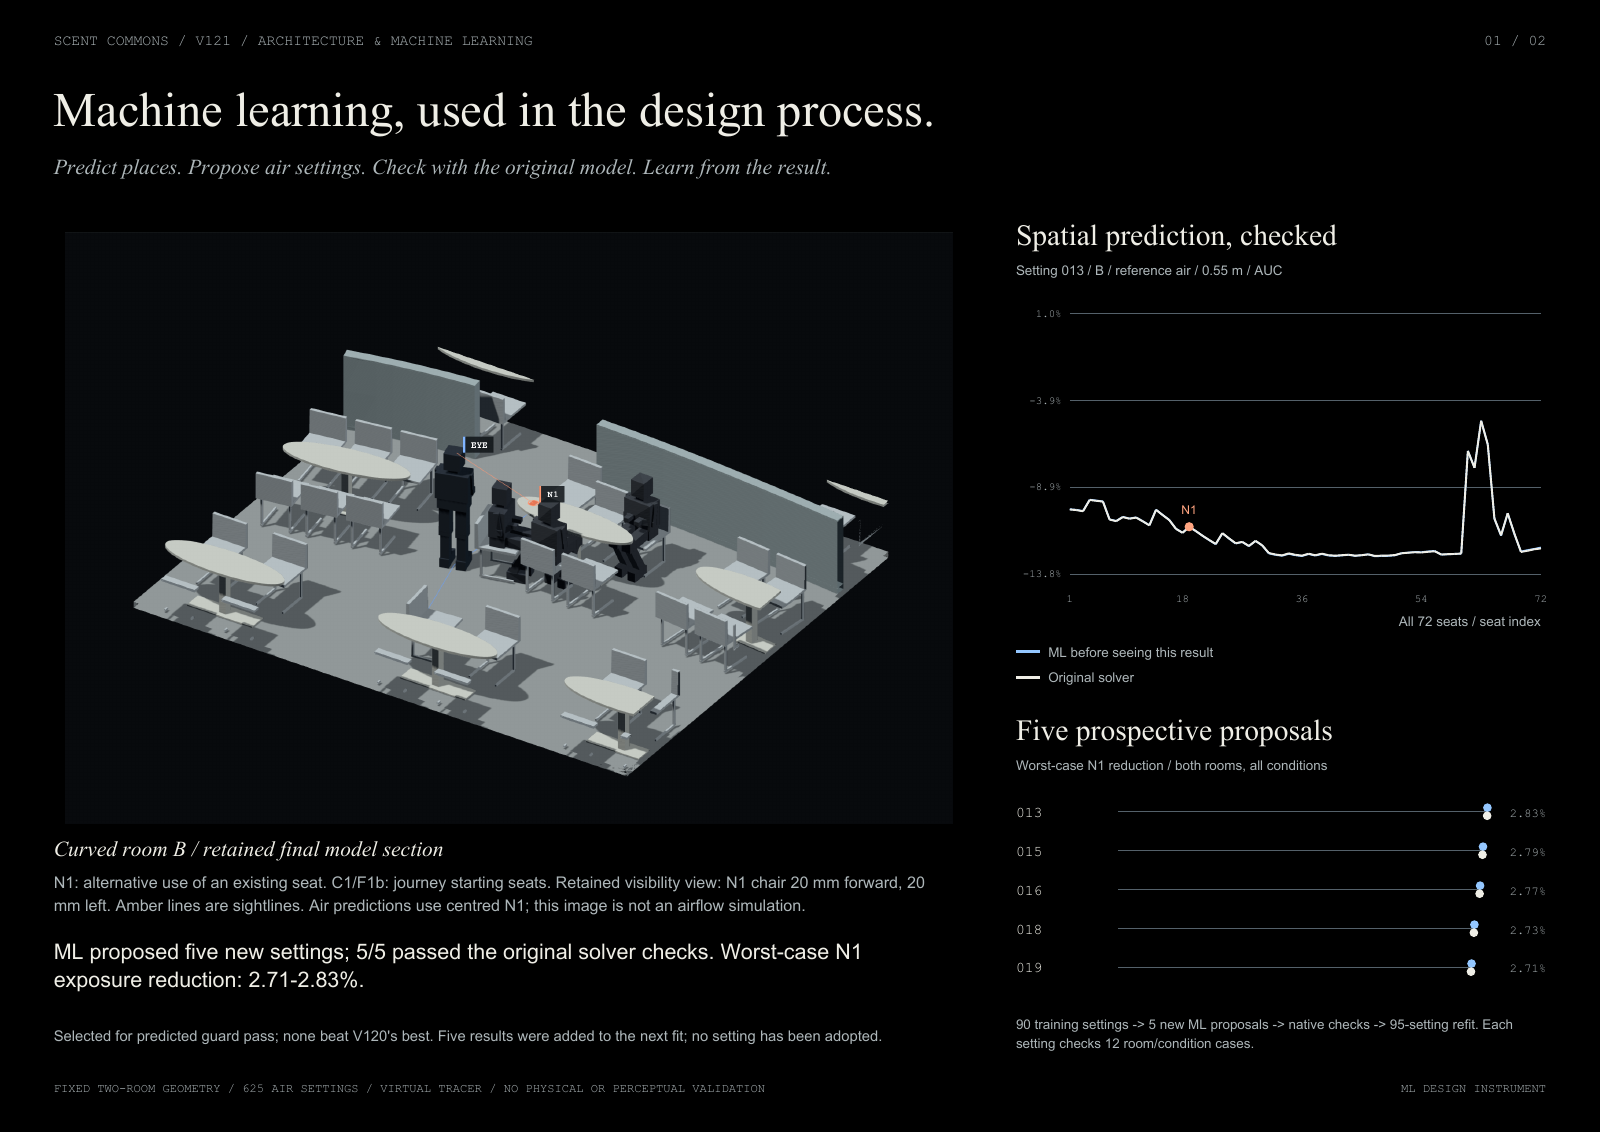
What did ML learn, and where did the data come from?
The training data came from the project's original spatial transport simulations: 90 previously computed ventilation settings, each tested in two rooms and six air conditions. These are synthetic tracer-model outputs, not sensors, smell ratings or measured human responses. The public odour-rating datasets used in earlier preference studies are a different data source.
Four inputs describe lower-versus-upper general extraction in three zones and the existing local supply redistribution. A learned model predicts seat-level cumulative exposure, sampled peaks and retained journey exposure relative to the same baseline setting. It then identifies the seat or journey most limiting the proposal. There are 3,840 distinct outputs per setting; restoring four duplicate N1 entries per case gives the original 3,888 checks. Outputs are not people.
The method uses principal-component analysis and Gaussian-process regression. It learns spatial response patterns before calculating the worst N1 response and the largest protected change. It does not predict satisfaction, recognise smell, redesign a room or move an outlet.
How did prediction enter the design process?
Learn → propose → check → update. The initial 90-setting model ranked untested settings by the original protection rules and N1 exposure. Five proposals were frozen before their original-solver checks: 60 new room/condition cases. Those five results were added to the training data, producing the final 95-setting model.
The local instrument runs the fitted model when the designer changes the four air controls. It shows the affected seats and limiting location, and provides a separate, explicit original-simulation check. The public comparison lets you inspect seven saved examples and switch between the two frozen model stages; it performs no live prediction, new simulation or retraining.
The seven examples are the reference, five prospective proposals and an adverse development setting. They illustrate the tool; they are not the 40-setting fresh validation set. Predictions remain separate from original-solver results.
What did the checks show?
All five proposed settings preserved the numerical guards for every declared seat and journey. Their worst-case N1 cumulative exposure fell by 2.71–2.83% against the matched reference. This is a ventilation-setting result in the model, not an added benefit over the earlier best setting.
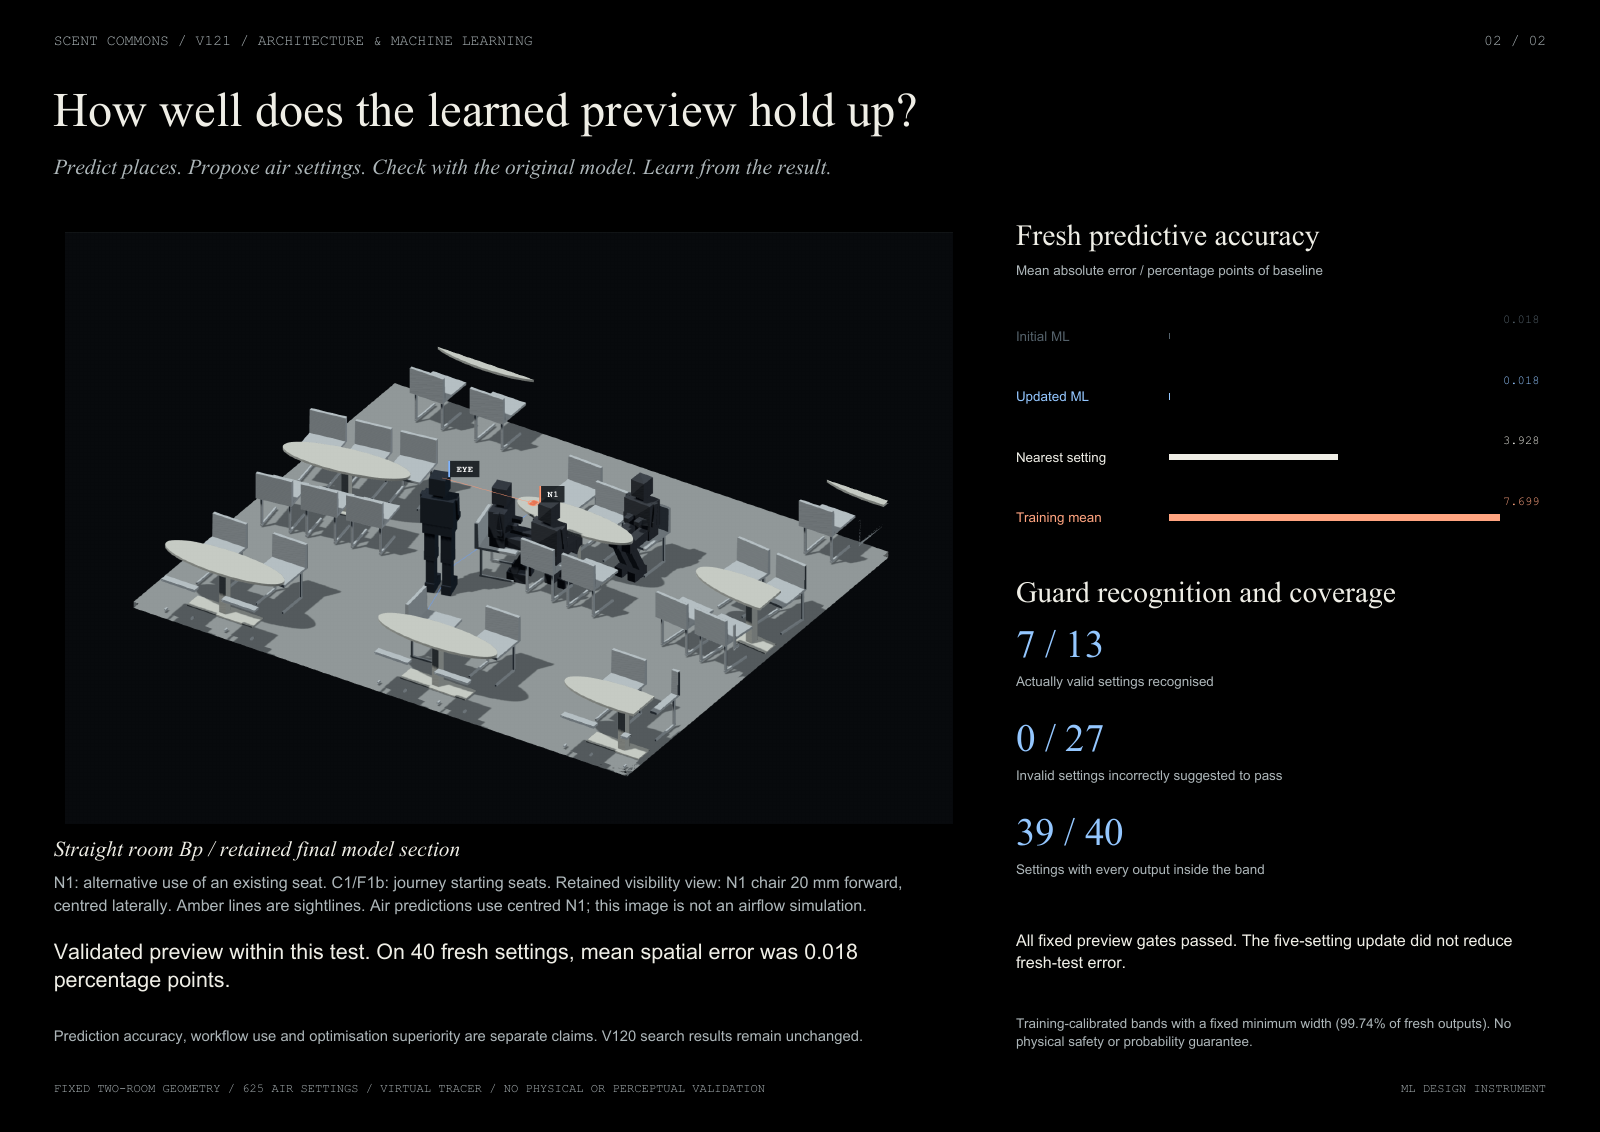
After both models and all predictions were frozen, a separate 40 previously unsimulated settings supplied 480 fresh cases. The final model's spatial mean absolute error was 0.018192 percentage points of matched-baseline exposure ratios, compared with 3.928 for the nearest-setting predictor and 7.699 for the training mean. These are prediction errors on the same test, not human success rates or “99.98% accuracy”.
The point predictions classified all 40 settings correctly. Using the conservative upper band recognised 7 of 13 valid settings, deferred 6, and incorrectly approved 0 of 27 invalid settings. All outputs lay within the band for 39 of 40 settings. The preview met the criteria fixed before the test.
The five-setting update did not improve accuracy: mean spatial error changed from 0.017828 to 0.018192 percentage points. The proposals cluster near the known best corner, limiting their information diversity. Learning from new results worked; an accuracy gain from this particular update was not shown.
What does this result allow us to say?
ML is used as a checked design instrument: it previews spatial effects, chooses settings under constraints and receives original-simulation feedback. Additional search superiority remains unproved: the earlier V120 comparison found the same best setting with ML and conventional search, and these five proposals do not improve it.
The error band has a fixed minimum width. That minimum applies to 99.74% of distinct fresh-test outputs in both models; the updated minimum is approximately −0.456% / +0.458% relative to the predicted ratio. The high coverage is not evidence that GP uncertainty alone is calibrated, nor a formal probability of feasibility.
The domain remains two fixed rooms, six air conditions and a menu of 625 settings. Lower extraction uses the existing 1.535 m terminals mapped to the 1.65 m model layer; it is not a floor-level outlet. Total supply is 4,680 m³/h. The prospective checks use the declared 250 mm / 0.5 s solver; no new refinement audit or final-setting adoption followed.
The model is a three-layer spatial transport graph, not detailed CFD. It does not validate perceived smell, comfort, health, furniture wakes, hardware performance or fan-energy savings. N1 is an existing-seat alternative; C1 and F1b are retained journey starting locations. The final N1 mark, routes, chairs and room geometry stay unchanged.
What did the calculation cost?
Producing the reused training data cost 9.292 worker-hours for 1,080 native cases. The 540 new proposal and test cases cost 5.155 worker-hours. Both fits and cross-validation took 1.413 seconds. The final model's median pure single-setting inference was about 0.325 ms; the public saved-data viewer is not that timing benchmark.
Training-data generation is retained in the account. Worker-hours are summed wall durations on shared hardware, not energy or an end-to-end speedup. Authoring, generic checks and uninstrumented I/O are outside that accounting.
Where this sits in Scent Commons
The spatial evidence map traces the completed C1/F1b route and N1 visibility decisions. The earlier three-room ventilation comparison reports its own ML/interpolation ties. The historical ML adoption gate remains failed for that earlier predictor. V121 is a different seat-level model for the final two rooms; it does not erase those results.
Original scientific results were checked with a separate Codex-authored verifier and actual Claude text-only implementation/corrective review. This publication exports selected derived results, not model weights or raw fields. Download aggregate results and provenance hashes · Download the seven recorded examples.