01 / Remove seats only
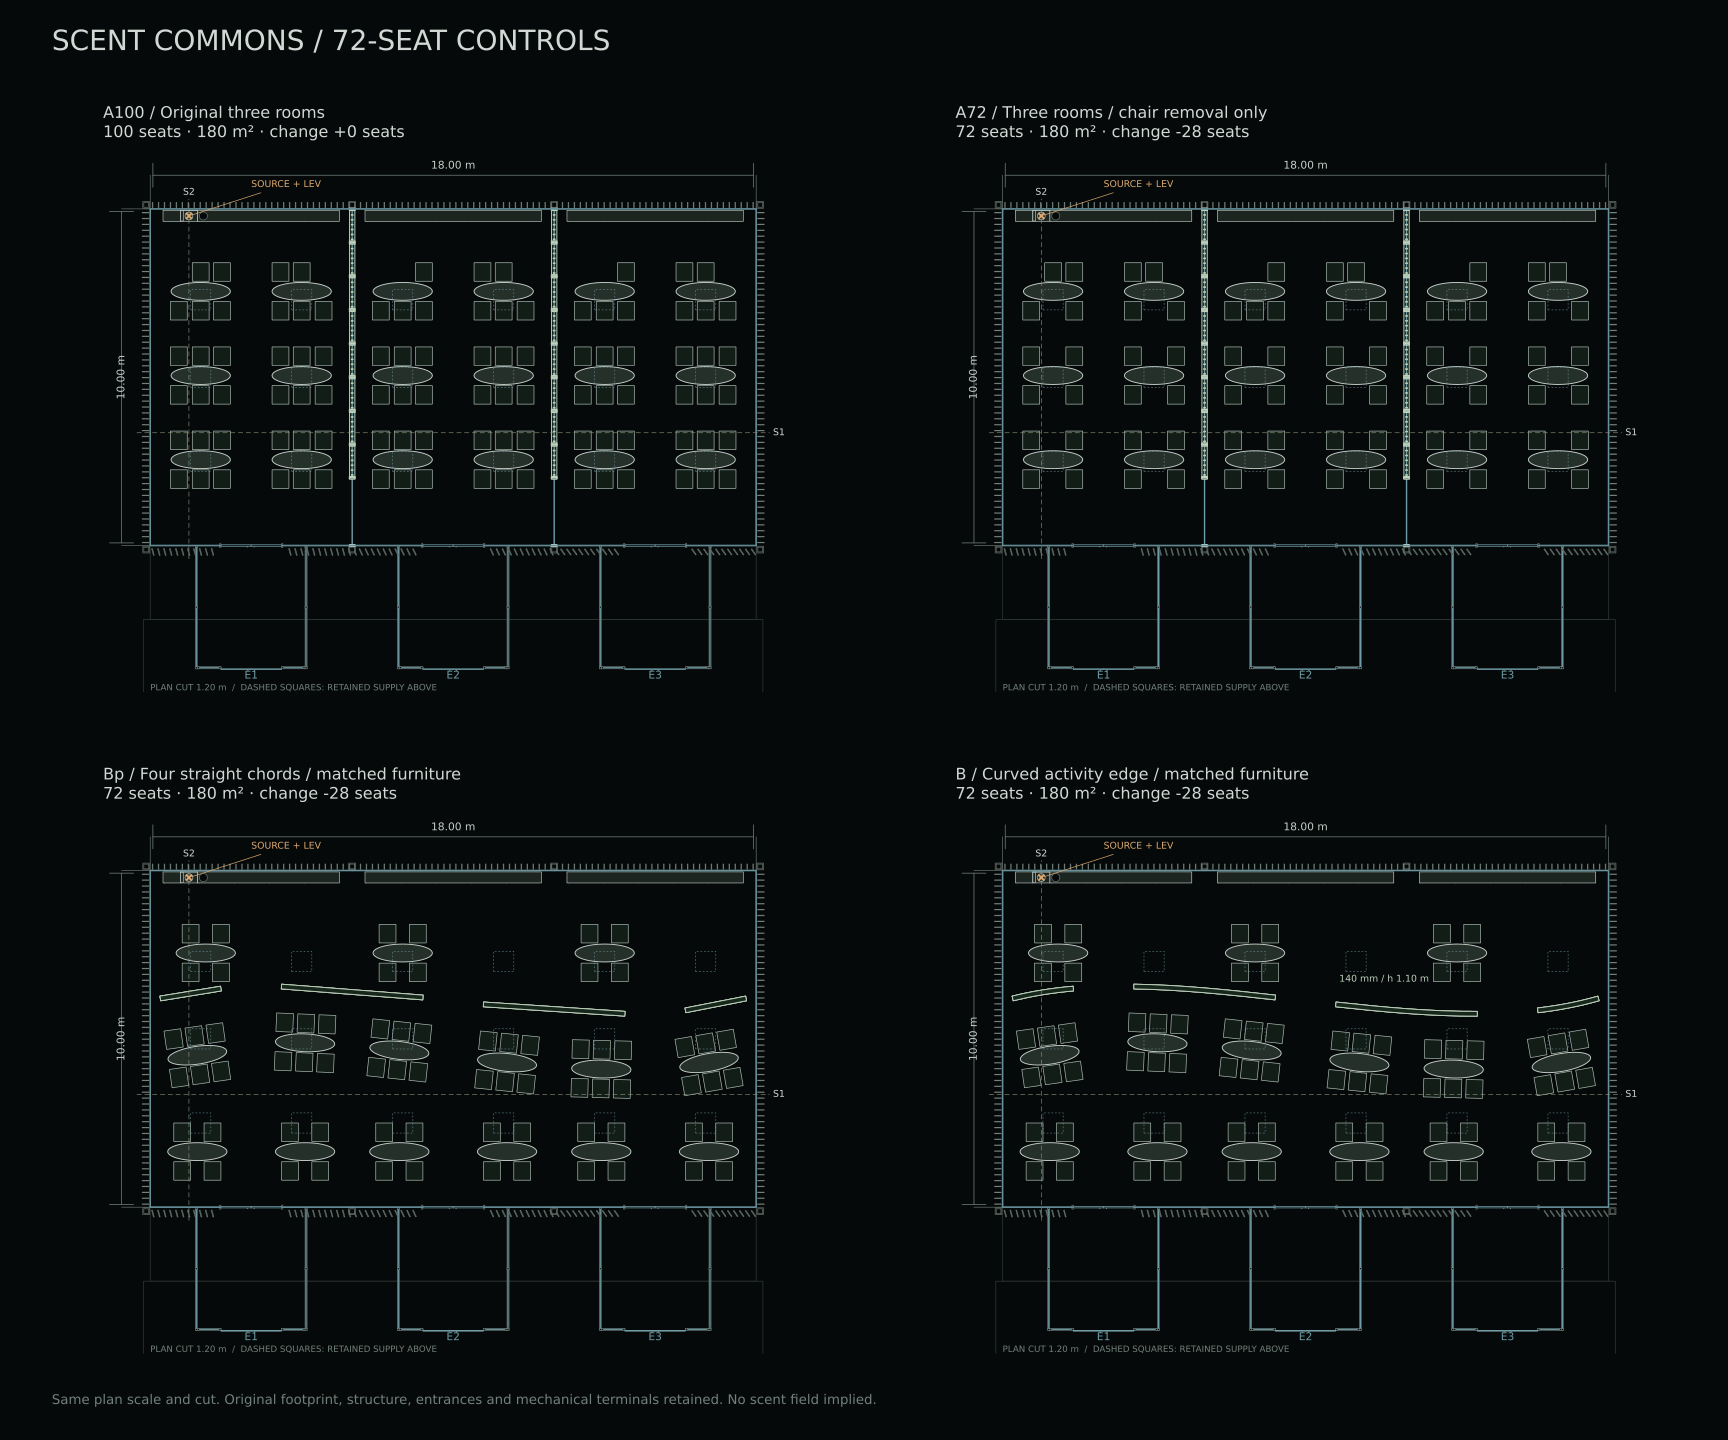
A100 → A72 preserves all three rooms, all 18 tables and every retained chair position. Twenty-eight chairs are removed by a fixed rule; each room keeps 24 seats. This separates chair removal from redesign.
Loading…
Drag to orbit · Ctrl + scroll to zoom · arrow speed is schematic · same scale and time across alternatives
CONTROL STUDY / 28 OCTOBER 2026
Personal scent needs, shared work and the option to step back remain the research question. These controls test what the spatial arrangement contributes before claiming that a curve improves scent or participation.
A100 → A72 preserves all three rooms, all 18 tables and every retained chair position. Twenty-eight chairs are removed by a fixed rule; each room keeps 24 seats. This separates chair removal from redesign.
A72 → B′72 holds capacity at 72 but changes boundaries, table locations and the table count from 18 to 15. This is a whole-layout comparison, not the effect of a single wall feature.
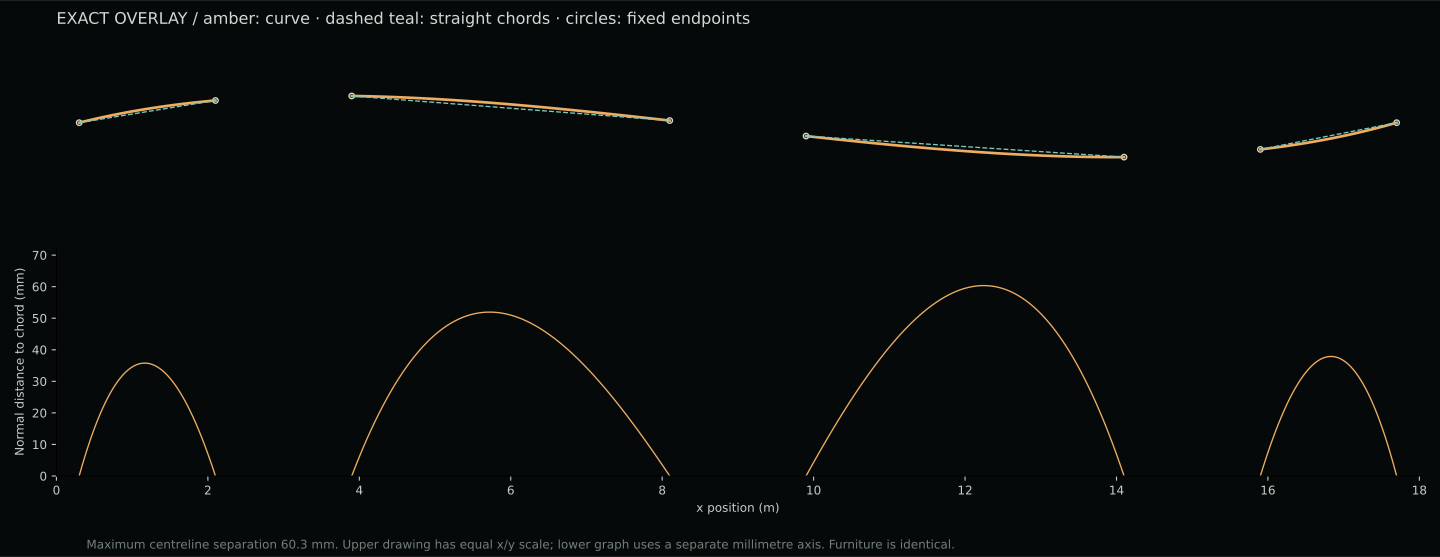
B′72 → B72 keeps every chair and table position and orientation. B′ consists of four straight chords through the original curved segments’ endpoints. Opening endpoints, 140 mm thickness and 1.10 m height stay fixed. B′ is an experimental control, not an independently optimised design.
| Alternative | Tables | Unoccupied floor* | Boundary length | Boundary footprint | Seat approaches** |
|---|---|---|---|---|---|
| A / 100 | 18 | 130.76 m² | retained assemblies† | 2.654 m² | 100/100 |
| A / 72 | 18 | 138.46 m² | retained assemblies† | 2.654 m² | 72/72 |
| B′ / 72 | 15 | 141.61 m² | 12.080 m | 1.691 m² | 72/72 |
| B / 72 | 15 | 141.61 m² | 12.088 m | 1.693 m² | 72/72 |
* Includes gaps between furniture; not all usable activity area. † A retains articulated panels and louvres; no equivalent total centreline length is claimed. B/B′ lengths refer only to the four new ribbon segments. ** 600 mm walking disc on a 50 mm grid, then a simplified 240 mm final reach. Not wheelchair, egress or simultaneous movement certification. No added interior area. Original structure, façade, entry system, source and mechanical terminals remain.
The fixed total supply remains 4,680 m³/h, general extract 4,320 and LEV 360. Nominal supply per capacity seat changes from 46.8 to 65.0 m³/h when capacity falls to 72. Capacity is not actual occupancy.
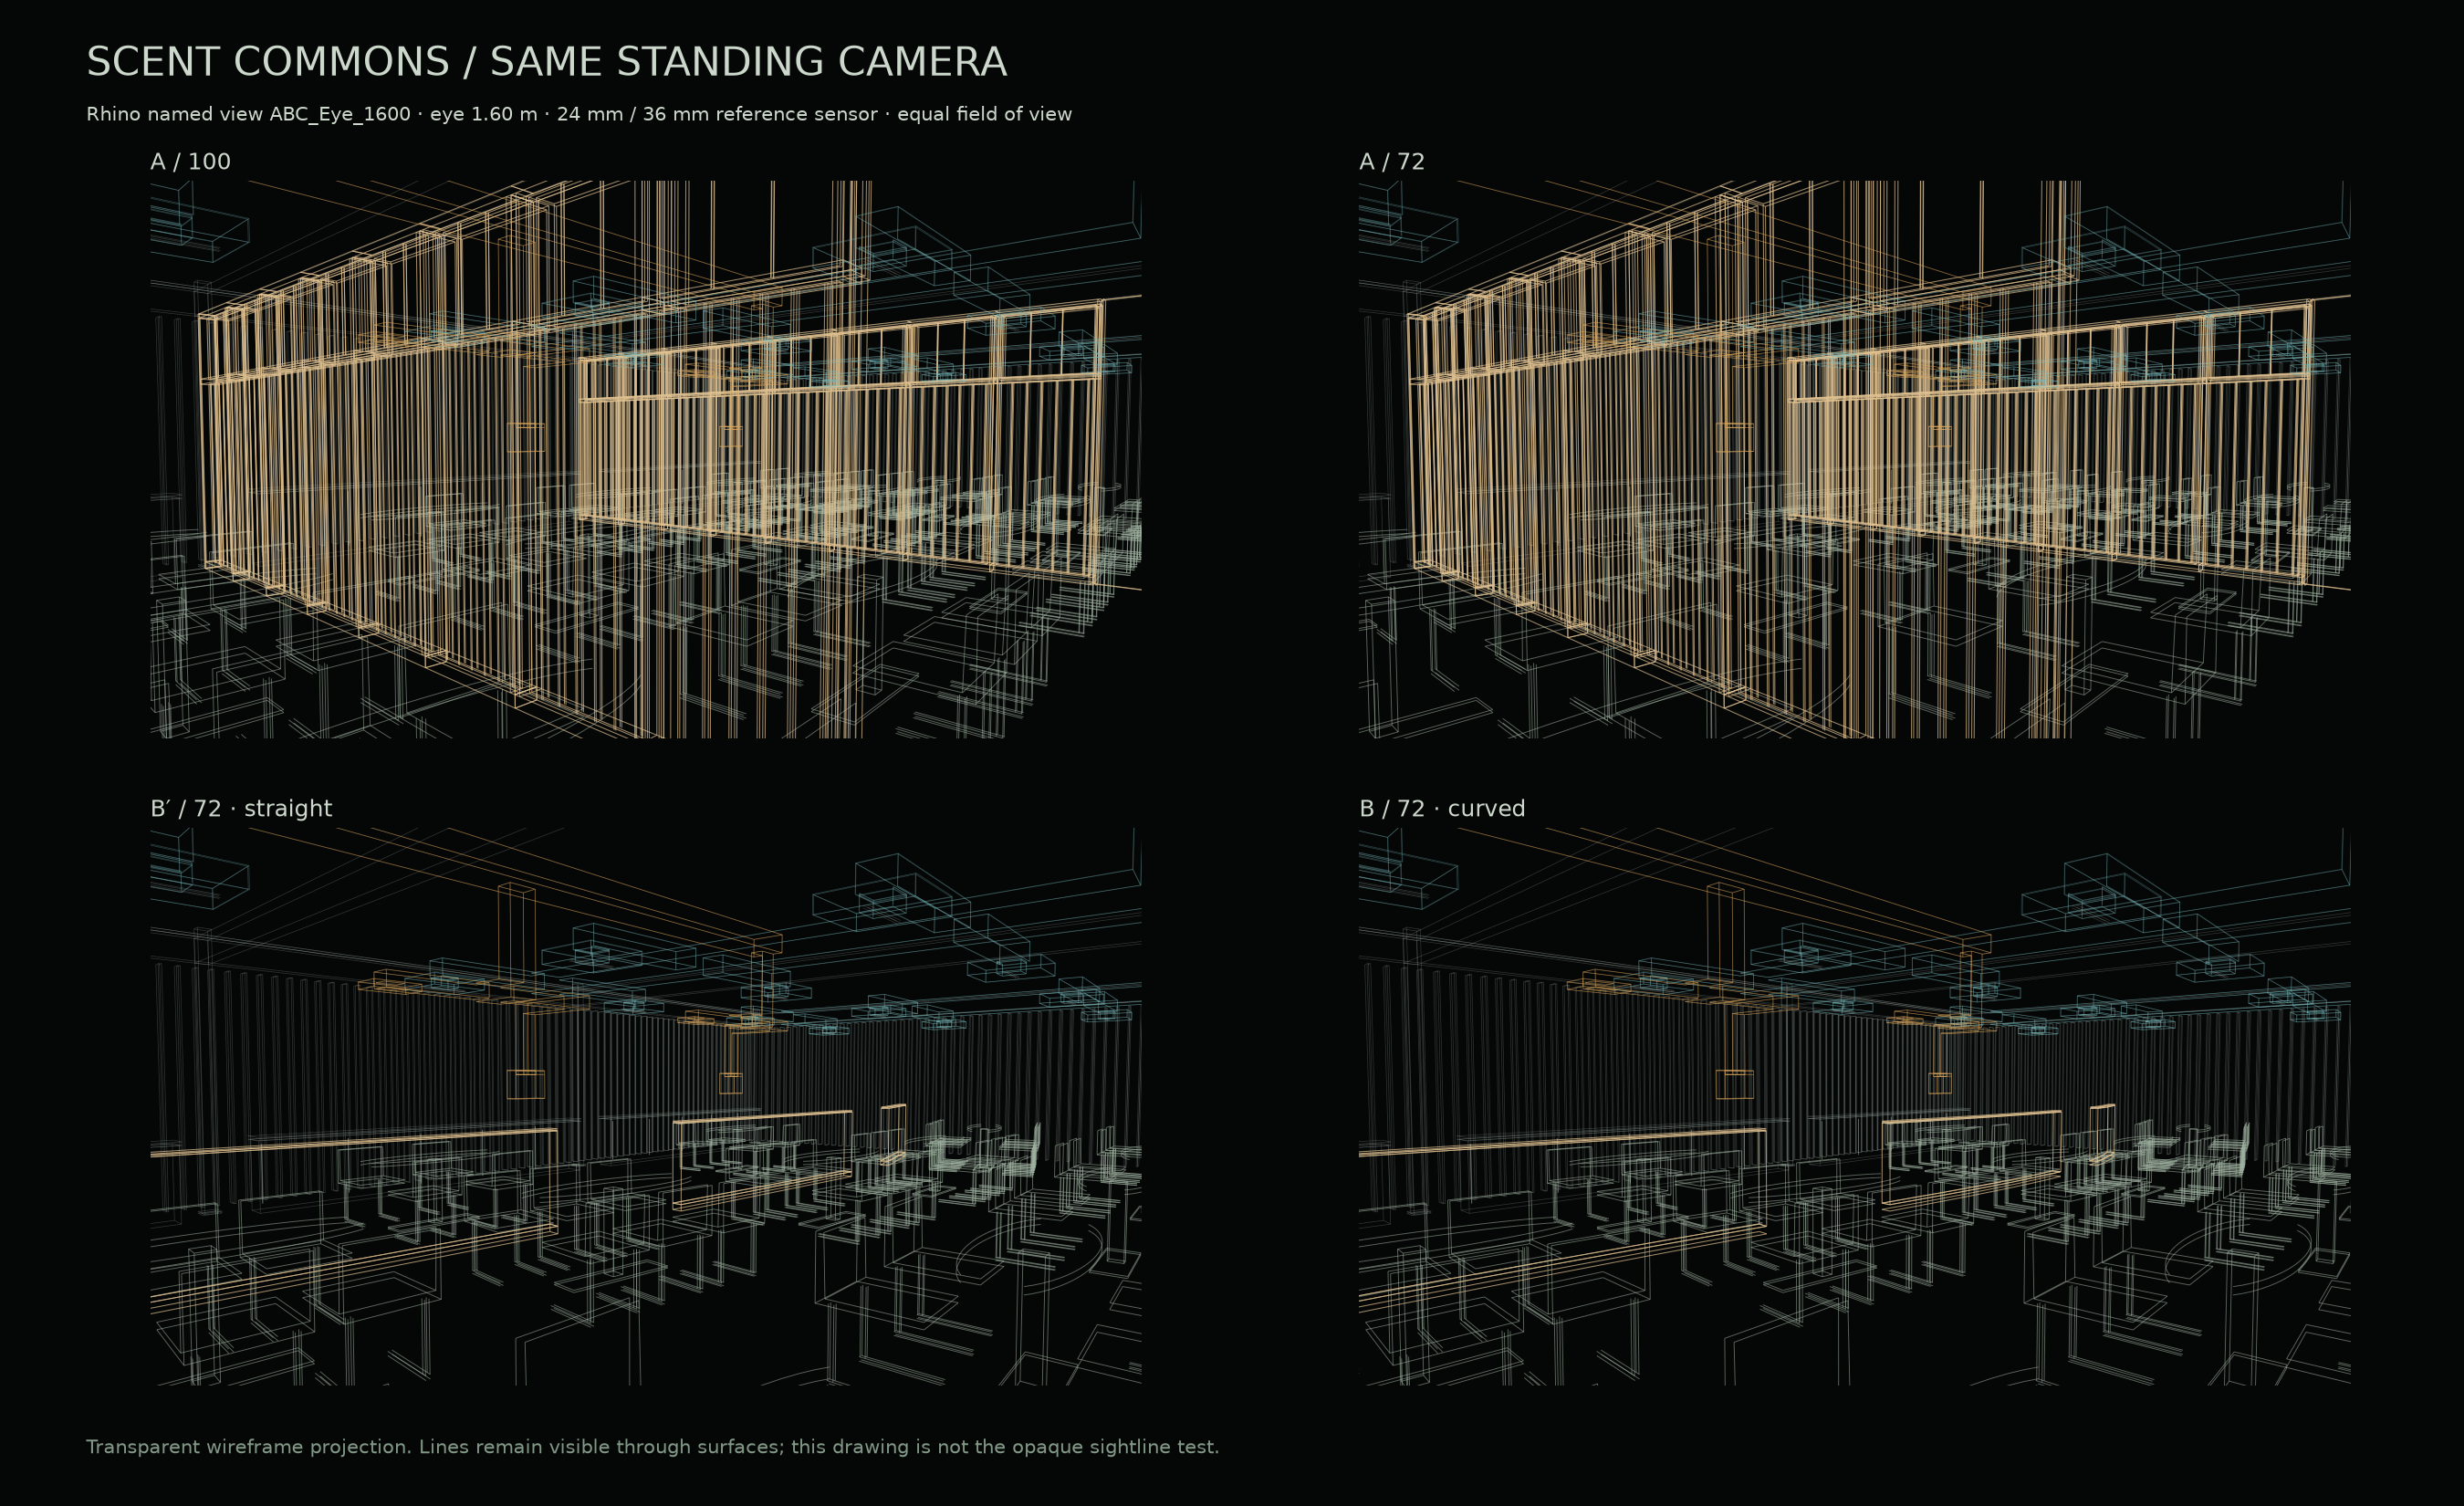
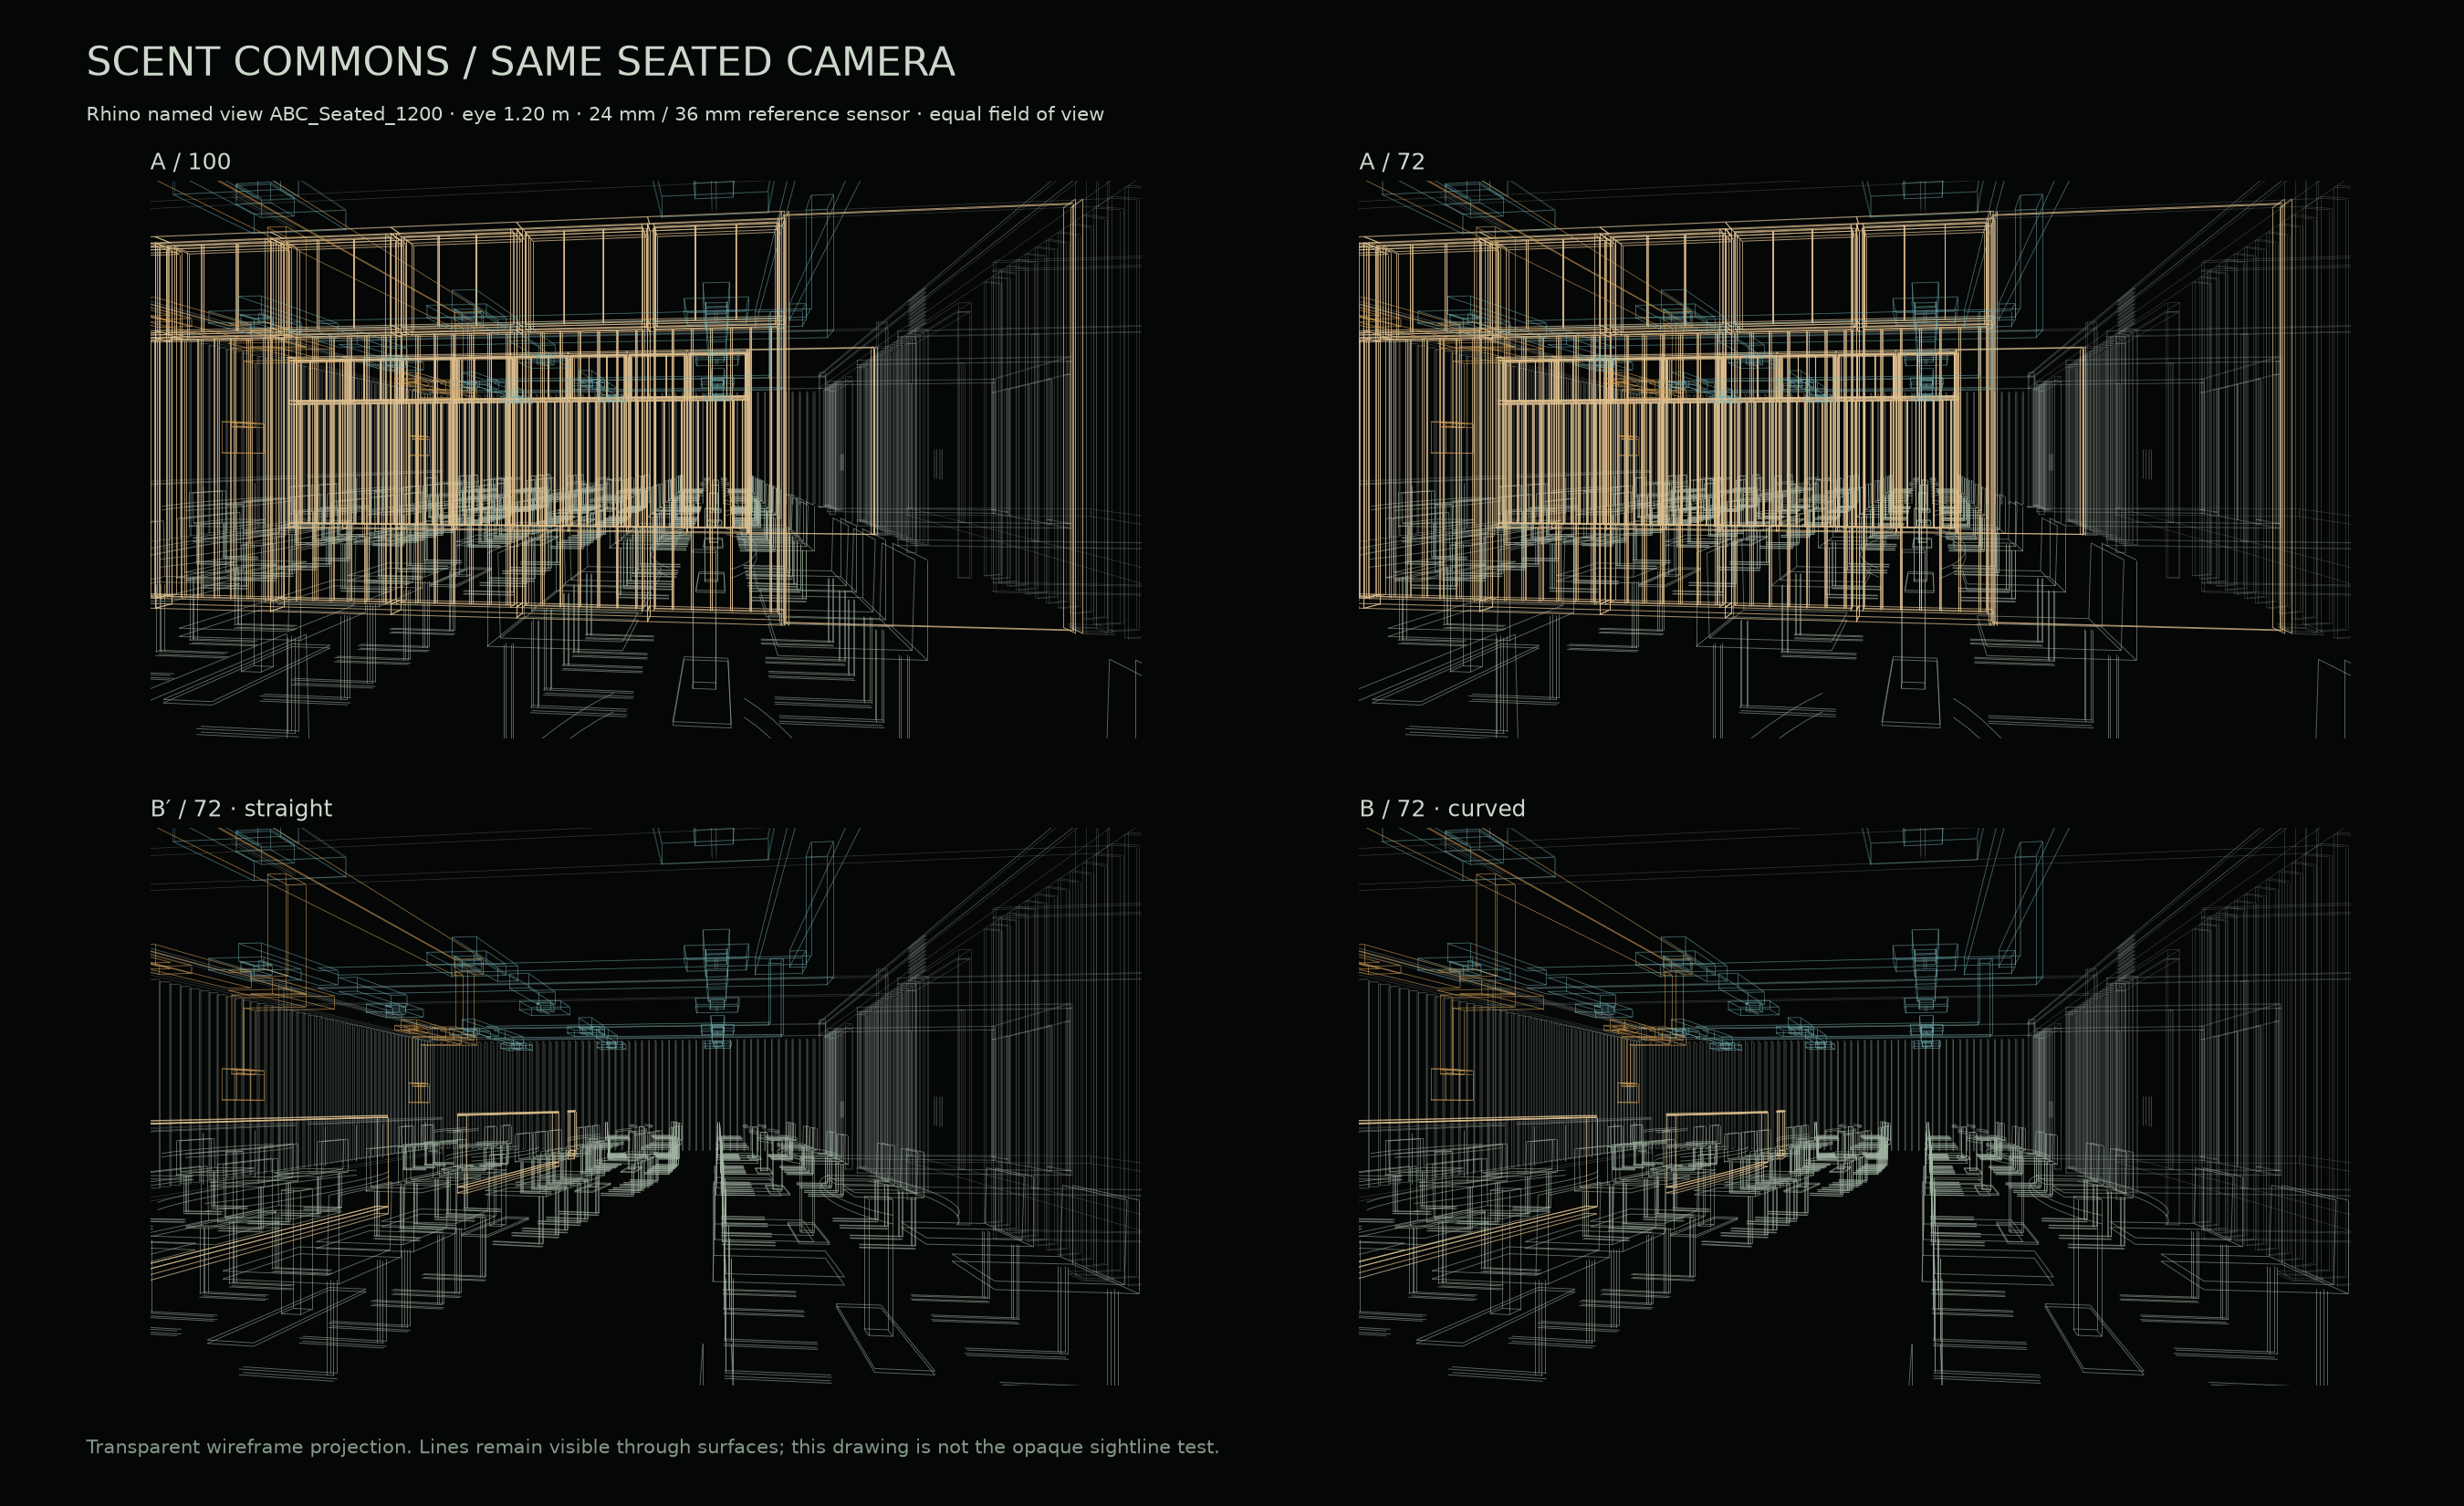
Standing at 1.60 m and seated at 1.20 m: identical named Rhino cameras and field of view across the four models. Transparent lines explain the geometry; they do not imply visibility through opaque walls.
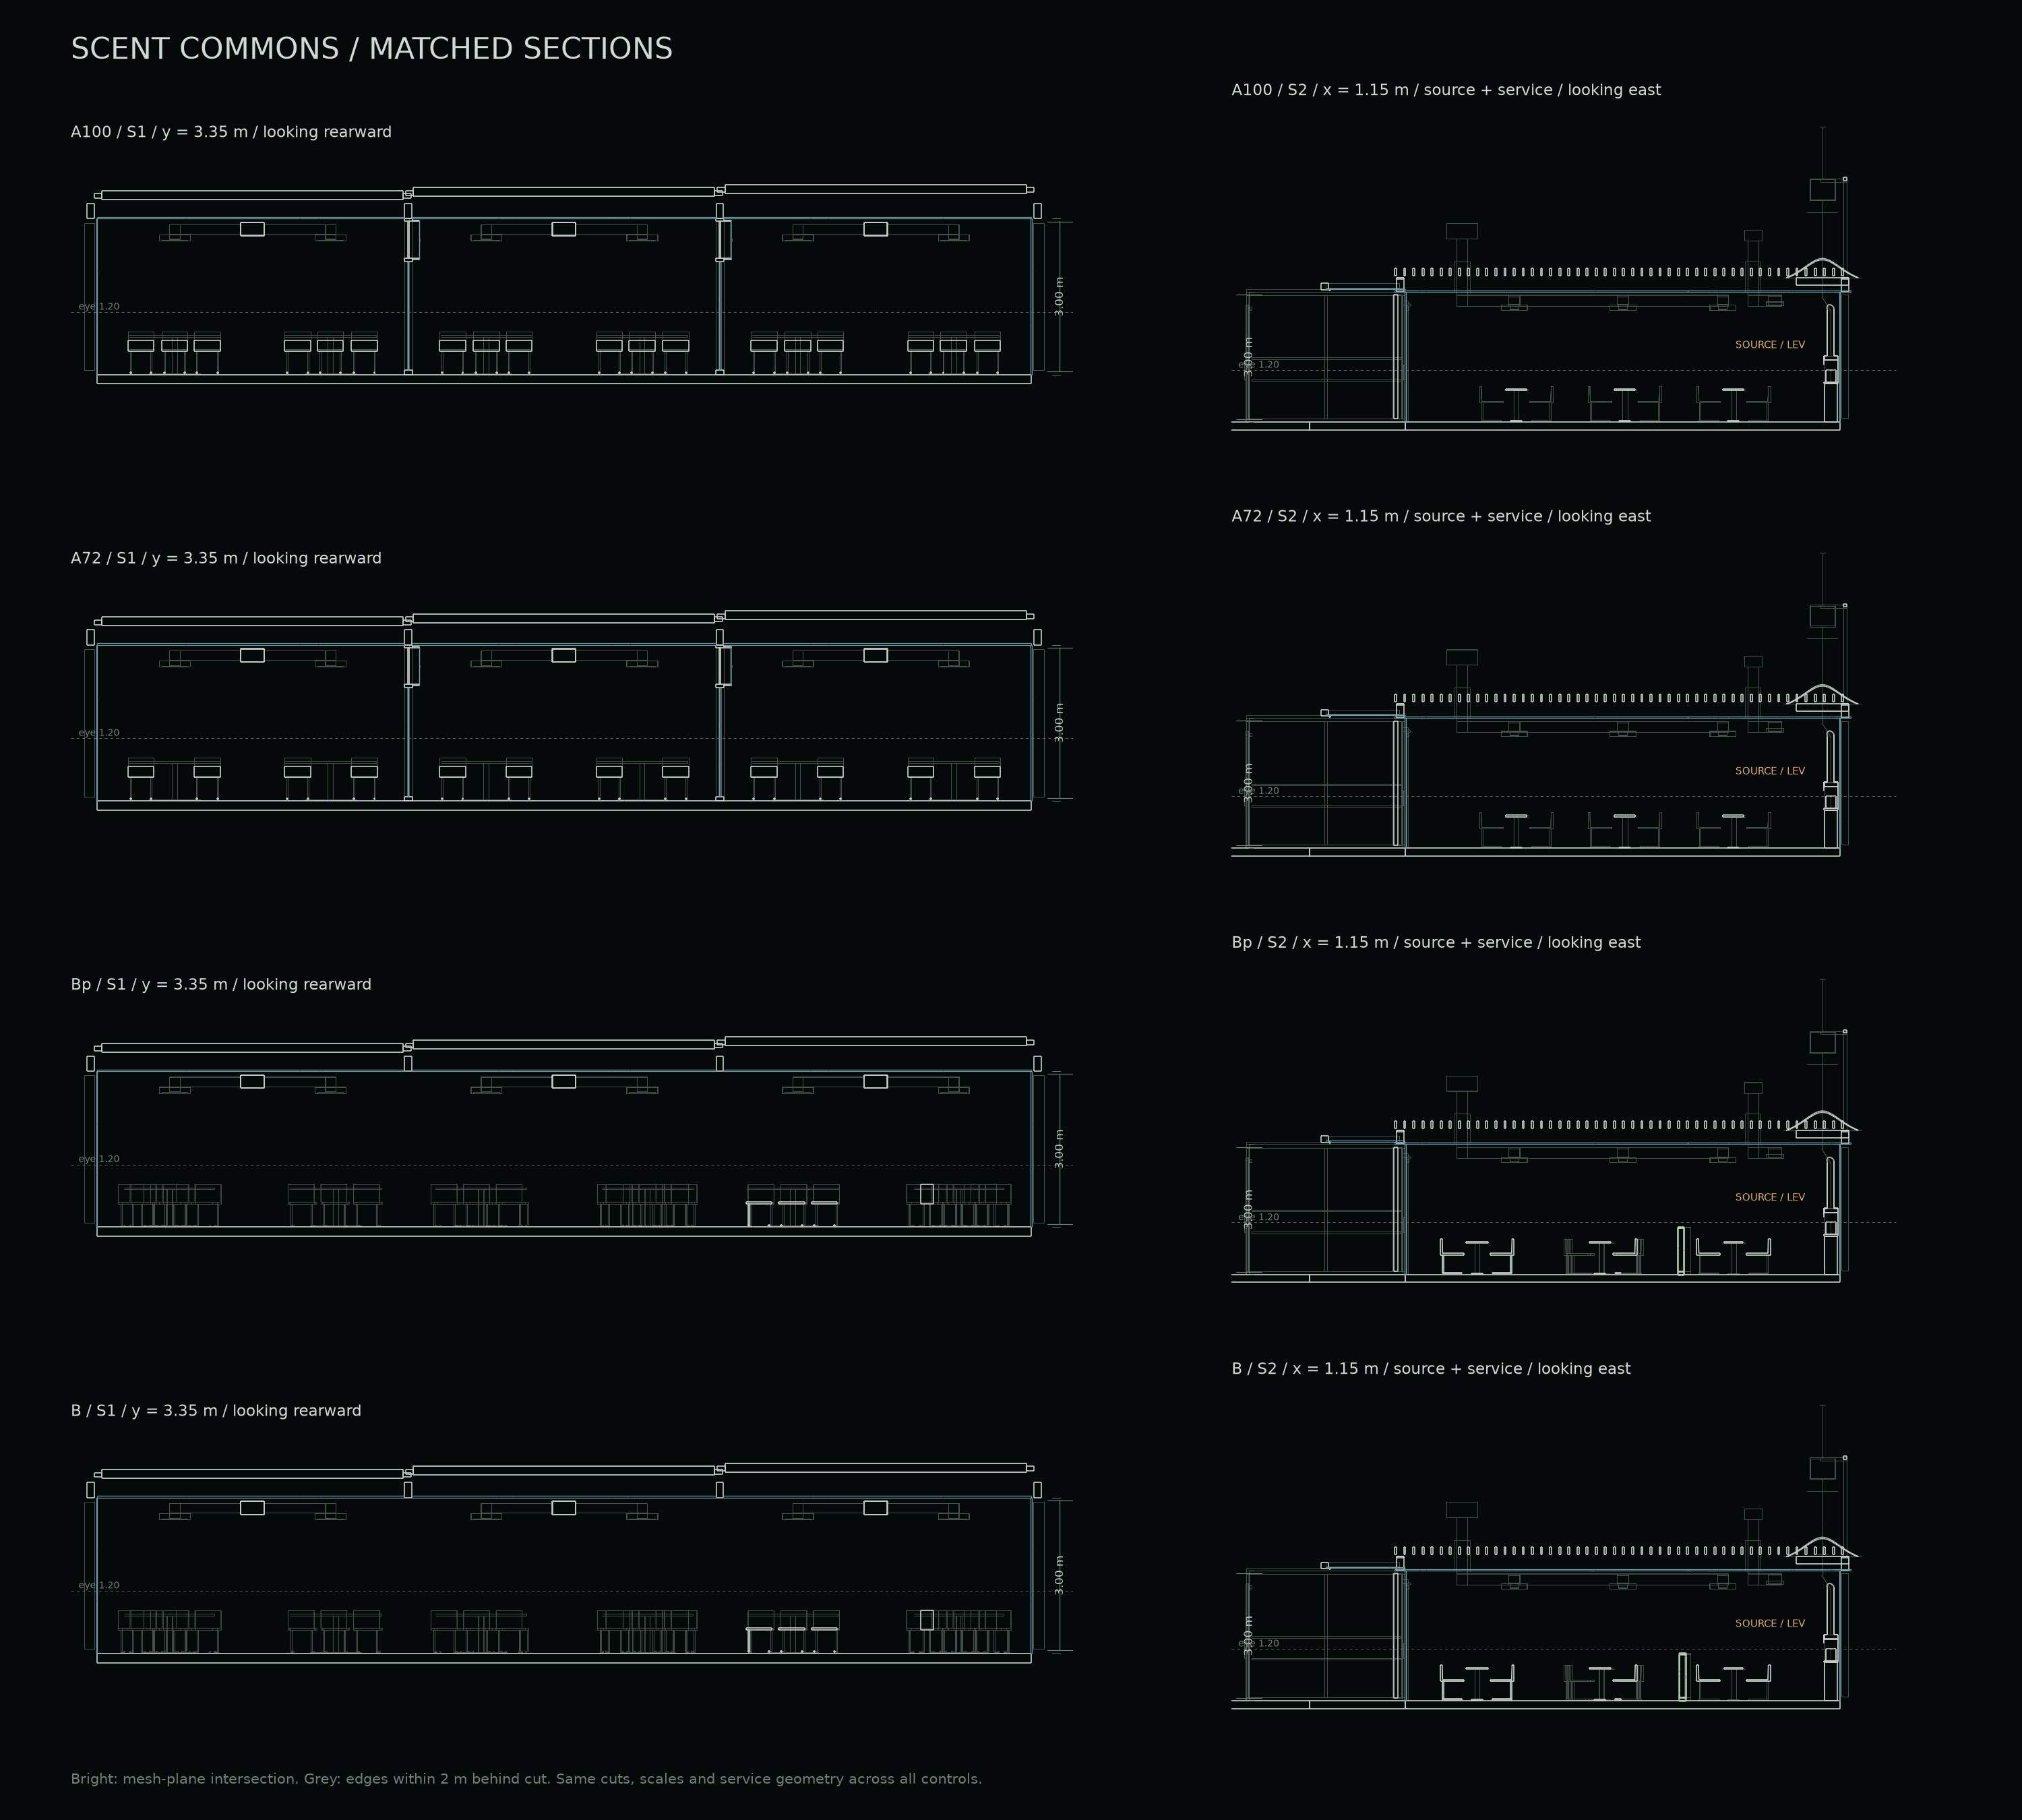
A loses 28 chairs and gains 7.70 m² of unoccupied floor. For the same 72 retained chairs, all approaches remain reachable. The largest route shortening is about 59 mm, close to the 50 mm grid resolution.
B and B′ both reach 72/72 approach points. Only one route changes by more than 10 mm, and the maximum difference is about 21 mm — below the grid spacing. None of the tested empty-reference or tabletop sightlines changes at the 72 identical positions.
These controls do not establish an advantage for the curved boundary. The curve can still organise the activity row, but that design intention is different from demonstrated performance.
Sightlines test empty reference points above one fixed activity table at 1.05, 1.20 and 1.35 m, and its tabletop. Bodies, posture, face recognition, speech and reading are unmodelled. A different activity position or boundary geometry could produce different results.
The original v8 flow remains available above with its original controls and results. This new comparison uses a separate mechanical-only graph experiment: actual Rhino wall sections obstruct transport in three height bands, and fixed supply and extract terminals drive a mass-balanced potential flow.
The façade is closed for this experiment. Vestibules and doors remain in the model but do not exchange air with outdoors. Furniture drag, people, thermal plumes, jets and calibrated odour perception are absent. This is not a reproduction of the archived v3 door-and-pressure experiment, and it is not CFD.
A100 and A72 show geometry only. Their diagnostic graph has three disconnected components: internal louvre and leakage paths are sealed, making Rooms 2 and 3 exactly zero by construction. That field and its removal ledger are withheld. No A-to-B scent comparison is made; use the original v8 flow for the archived A experiment. Chair removal is not modelled as an airflow change.
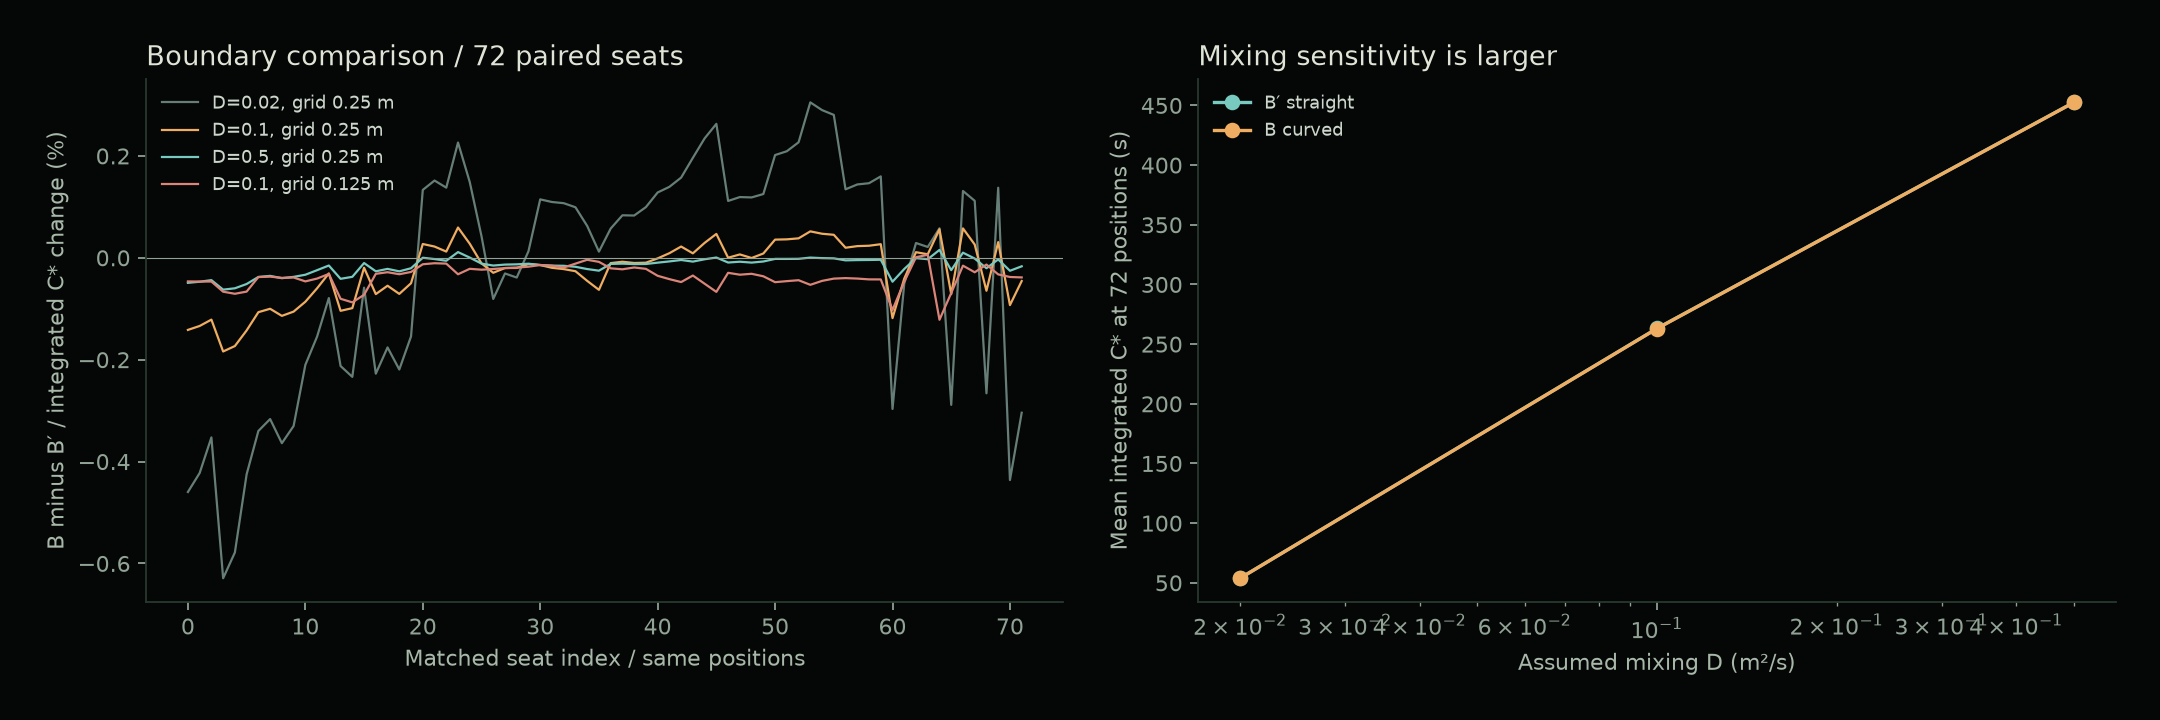
At the default mixing assumption, mean integrated C* across the same 72 sample positions differs by −0.047% on the 250 mm grid and −0.039% on the 125 mm grid. The absolute mean changes by about 1.8% when the grid is refined. Changing the mixing assumption has a much larger effect. A beneficial curvature effect is therefore unresolved by this model.
These sample values average the 1.10–2.20 m band, not breathing height. Nine diagnostic runs include one excluded A72 case and eight paired B/B′ mixing and grid checks. No new ML is trained. Displayed fields interpolate 10-second saved samples; route opacity crossfades between 20-second samples. Routes follow positive computed tracer flux; equal arrow speeds and line widths do not encode physical velocities or mass shares.
The wall-height band changes the sign. At the same 72 horizontal positions in the 0–1.10 m band, B−B′ is +0.051% on the 250 mm grid and +0.020% on the 125 mm grid. At D=0.02 the lower-band difference reaches +0.428%. These are not seated breathing-height predictions. A small negative number in the upper band is not a general curvature benefit. Positive lower-band differences are not a curvature penalty either: at D=0.5 the lower-band sign reverses again (−0.002%). Neither sign establishes preference or perceived comfort.
In fixed lower-band regions, the default front region (y<5.5 m) changes −0.042% / −0.019%, and the rear (y>6.9 m) changes +0.042% / +0.049% on coarse / fine grids. The same spatial regions are used for both shapes.
The lower grid blocks 99 / 93 neighbouring cell pairs for B′ / B at 250 mm, and 336 / 346 at 125 mm. The pairs that differ between shapes number 22 and 98. Cell masking and edge blocking both contribute: even the direction of the blocked-pair count reverses with refinement. Layer, region and topology evidence ↗
Unit tracer release for 600 seconds, then clearing to 1,200 seconds. The release point is the same declared 0.5 m hood-offset scenario as v8, not a measured emission location. C* uses unit emission divided by total supply as a common reference. Actual wall thickness is sampled on a grid: thin-wall and curved-wall discretisation remain limitations.
All nine runs have non-negative concentration within solver precision. The largest relative tracer mass-balance residual is 7.85e-13. Constant-tracer and mechanical volume-balance checks pass. Two additional 1-second time-step runs retain the paired difference (−0.0468%); absolute means change by about 0.034%. Stored mass decreases after release stops. These establish numerical consistency, not physical validity.
P1 seeks scent; P2 requires no perceived scent. Neither requirement is established by a concentration map without an odour source and perception model.
P3 asks all four people to share the same table. If P4 moves to a retreat while the others remain, that strict demand is not met in any layout.
P4 asks for distance while keeping contact. Empty sightlines do not validate participation. These are explicit hypothetical requirements, not observed behaviour or satisfaction.
Original models and research records are preserved. Every control model keeps the same named Rhino cameras. The next useful test is an activity requirement that might justify a boundary change, followed by physical airflow evidence for a selected candidate. A larger ML run will not resolve the current geometric and perceptual uncertainties.