Architecture & Research
Architectural projects and computational studies exploring how data, AI and real-time information can shape the way spaces are designed, used and adapted.
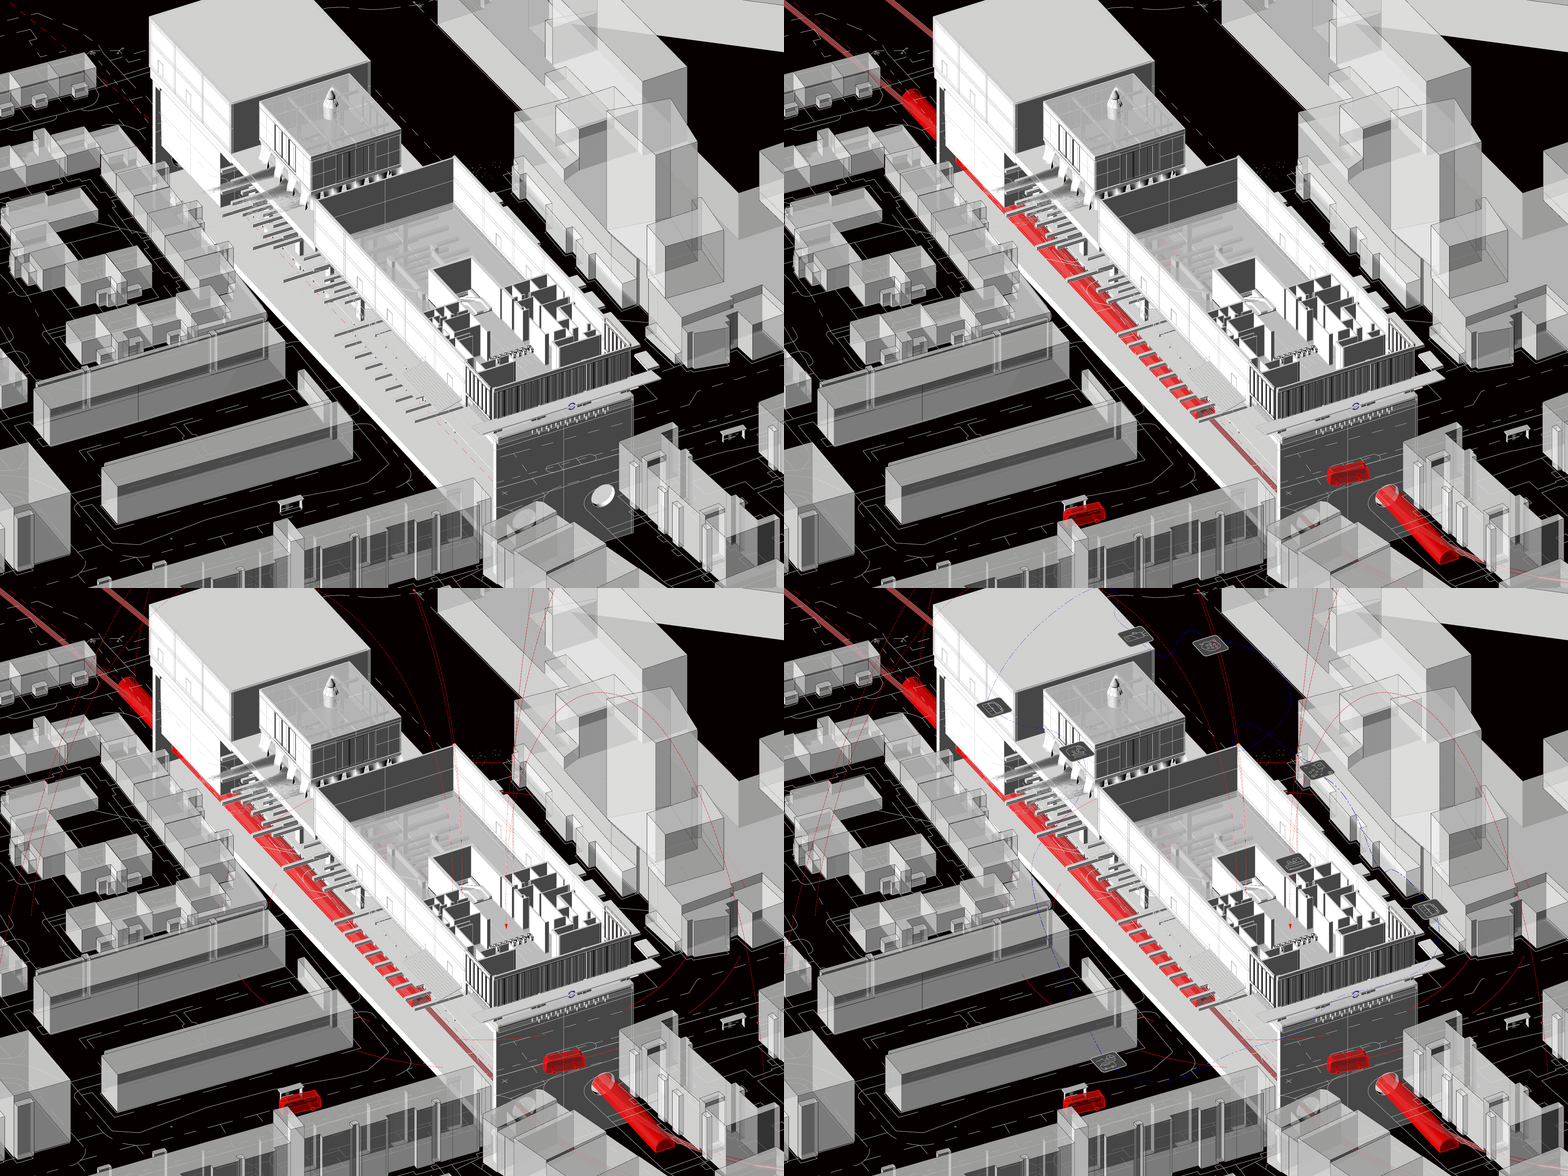
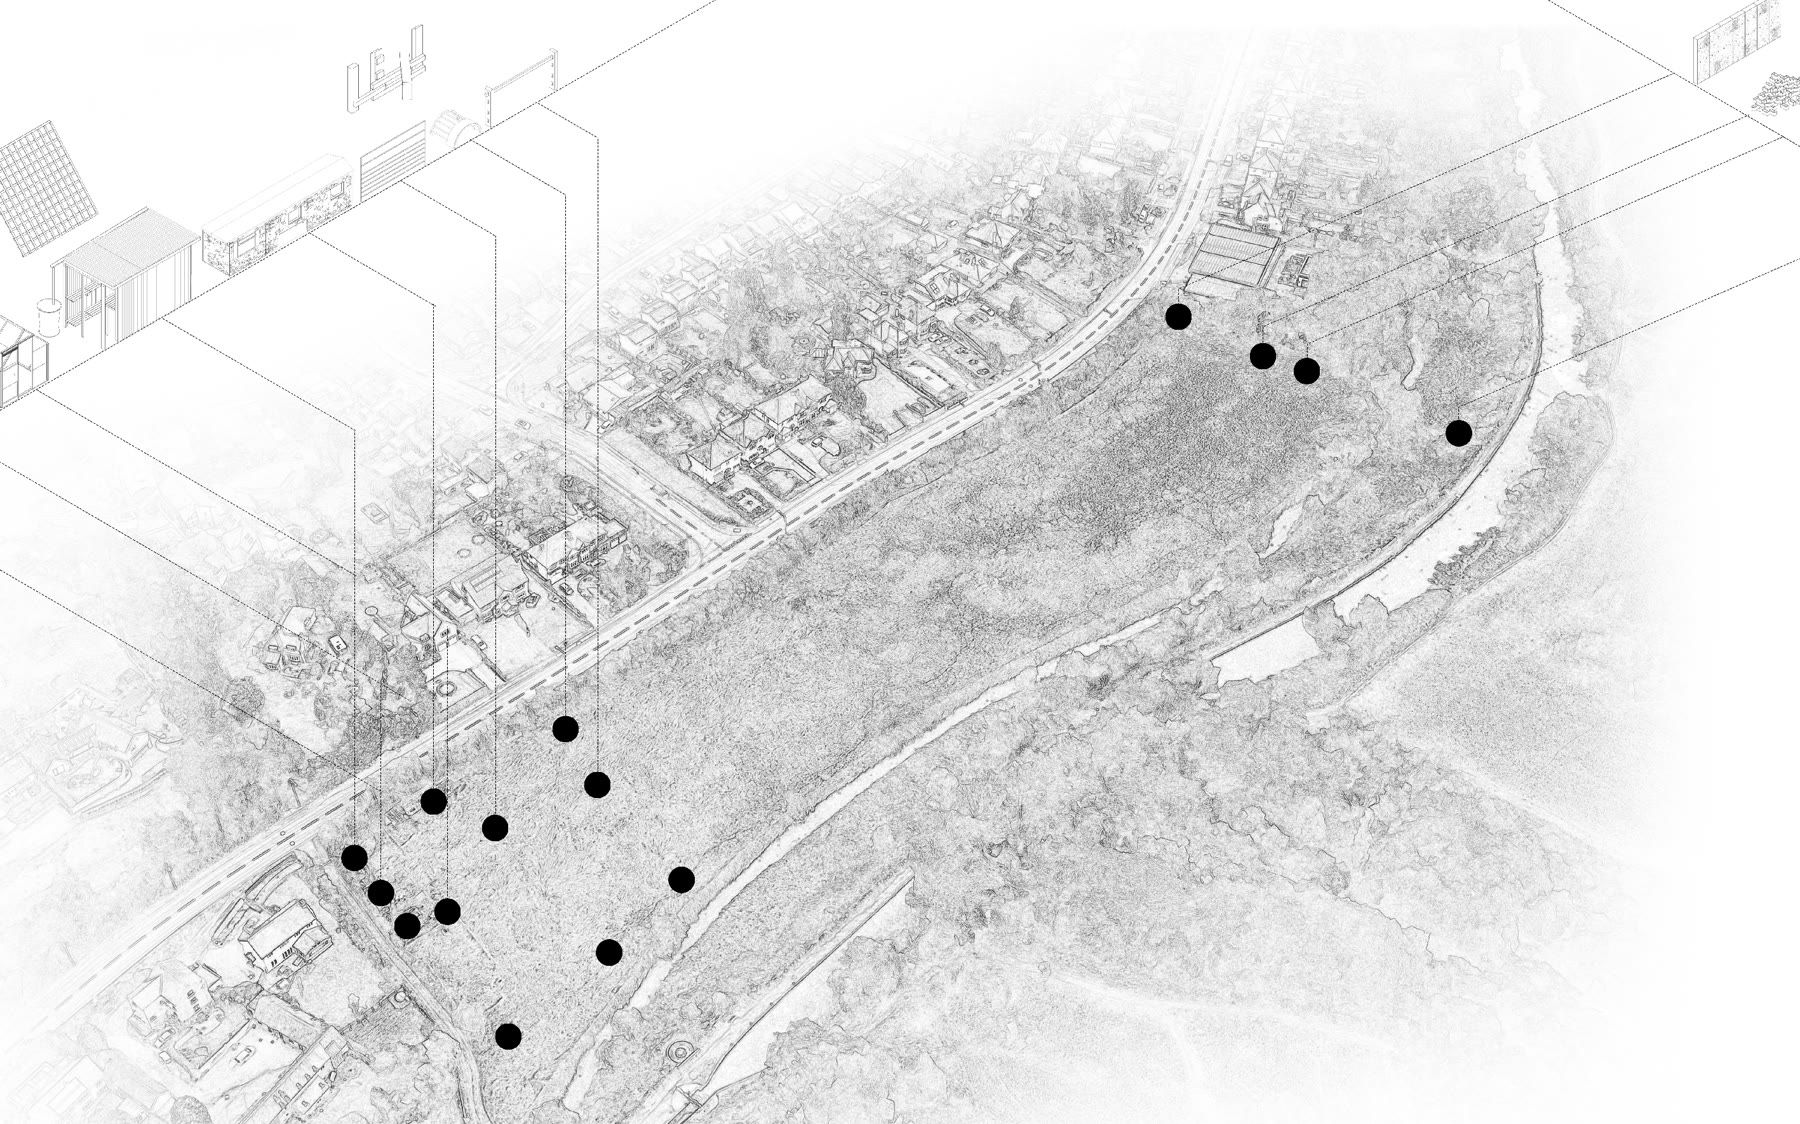
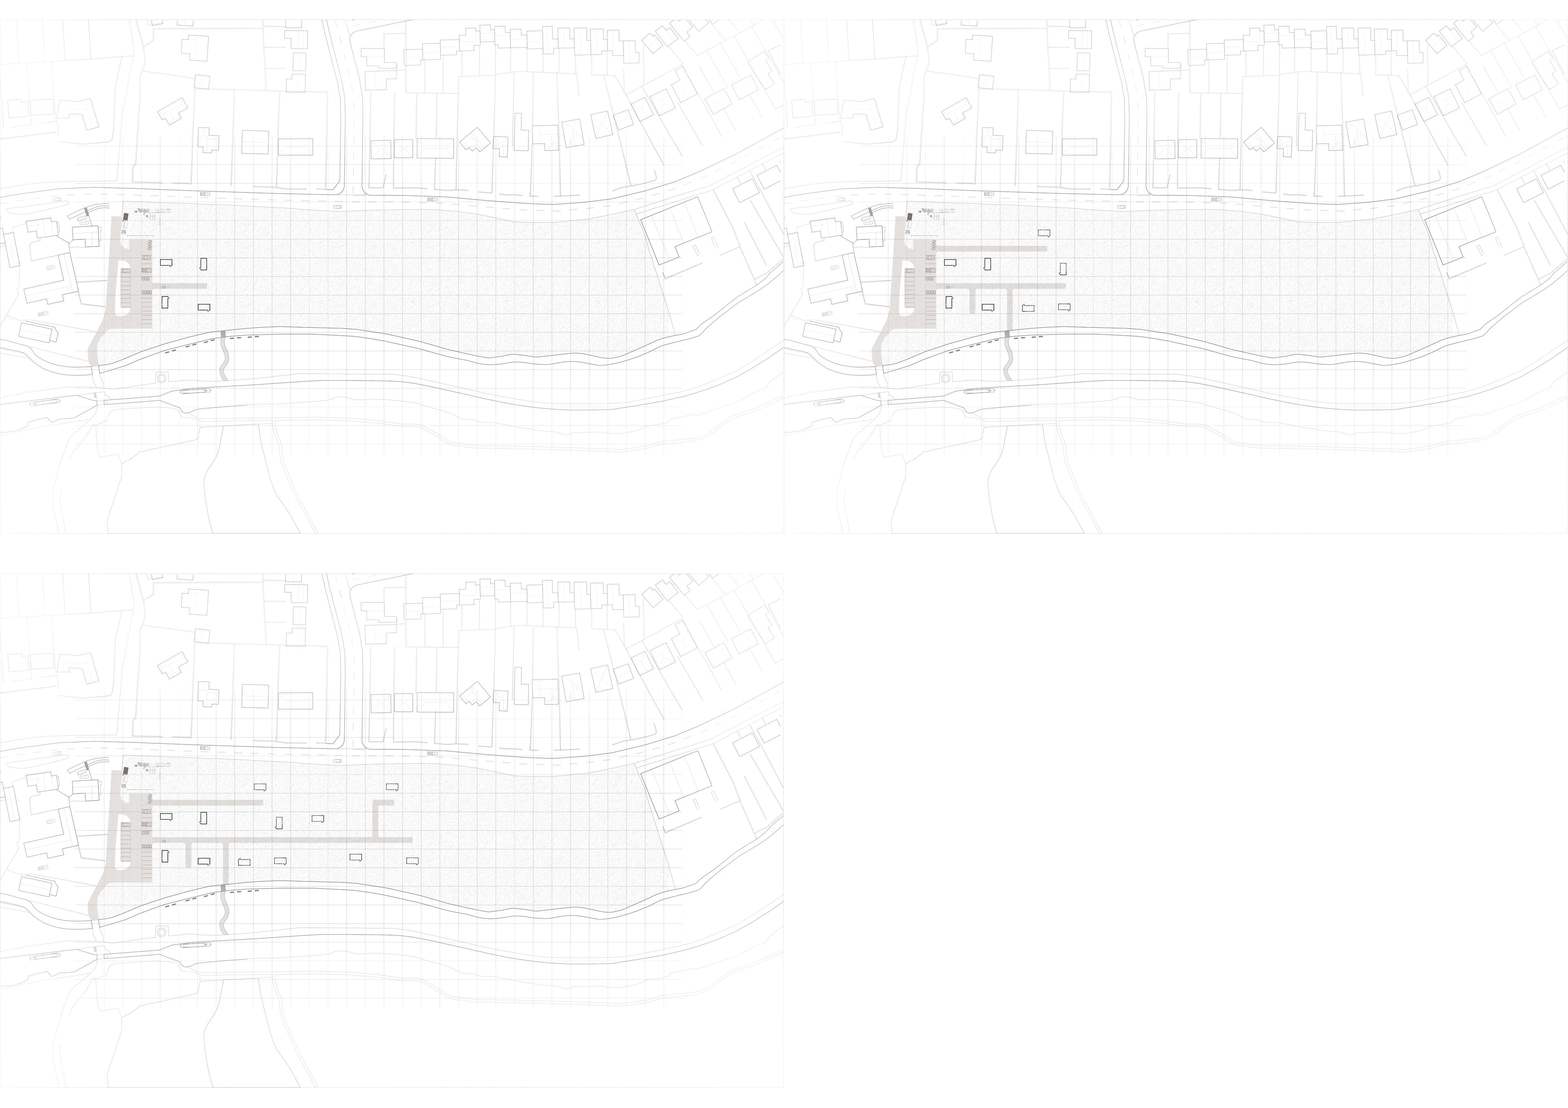
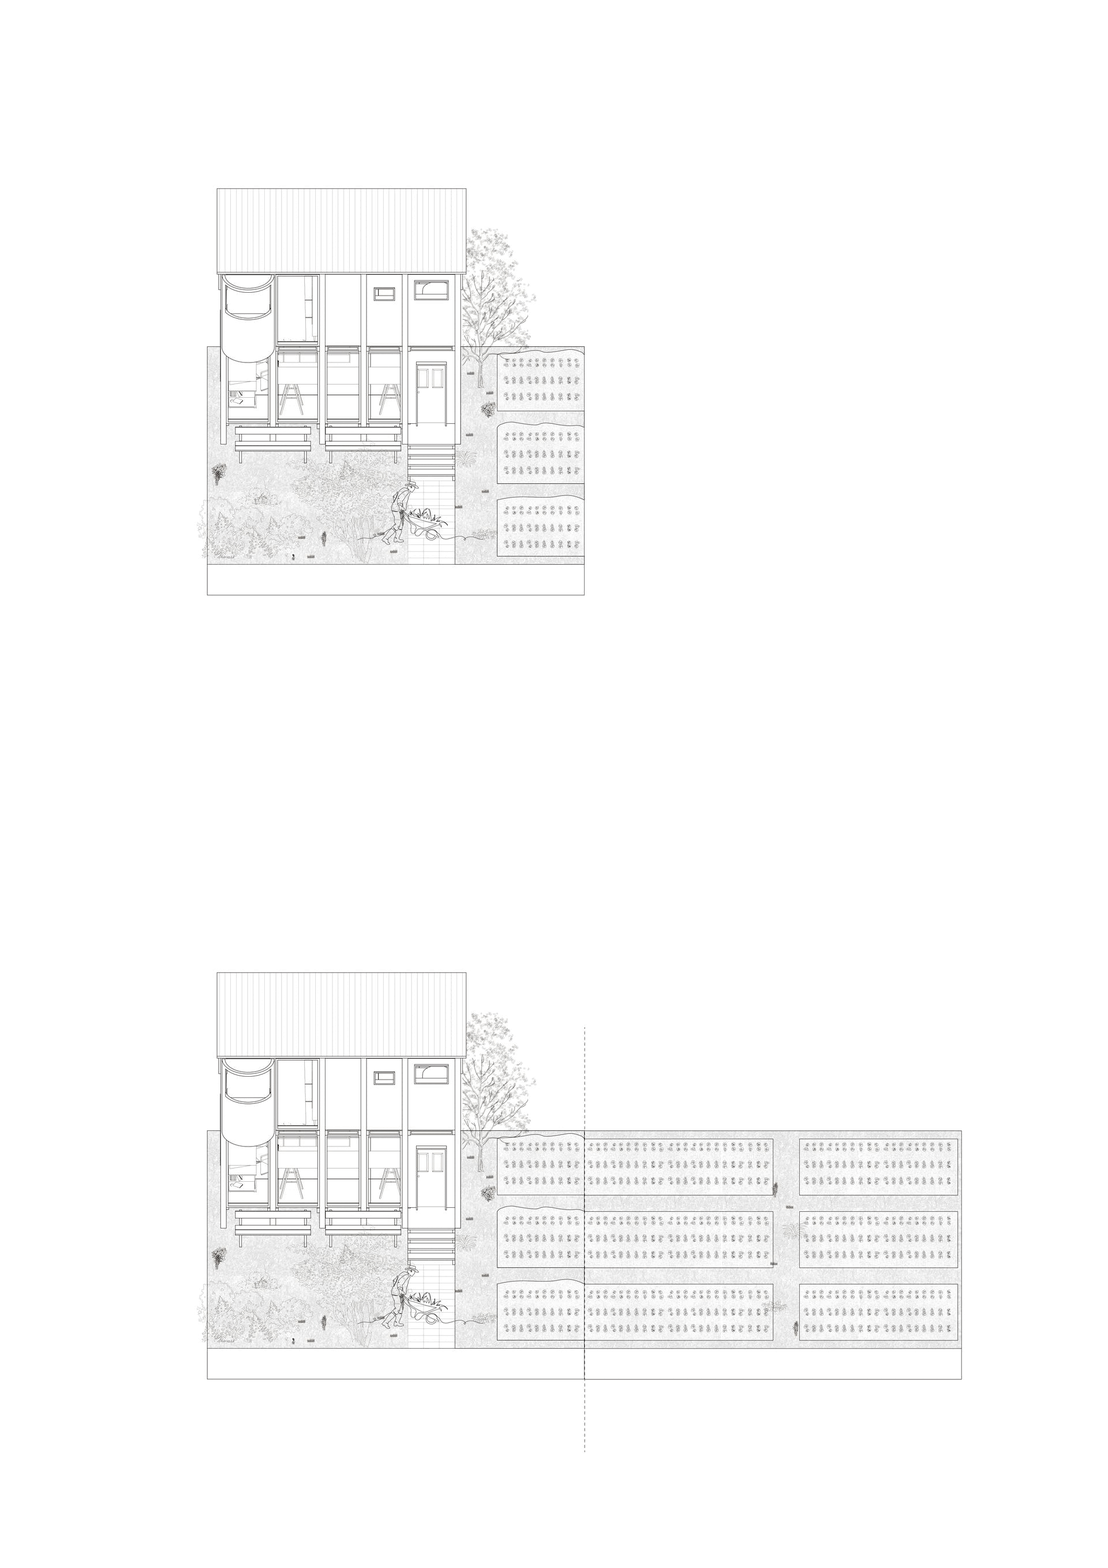
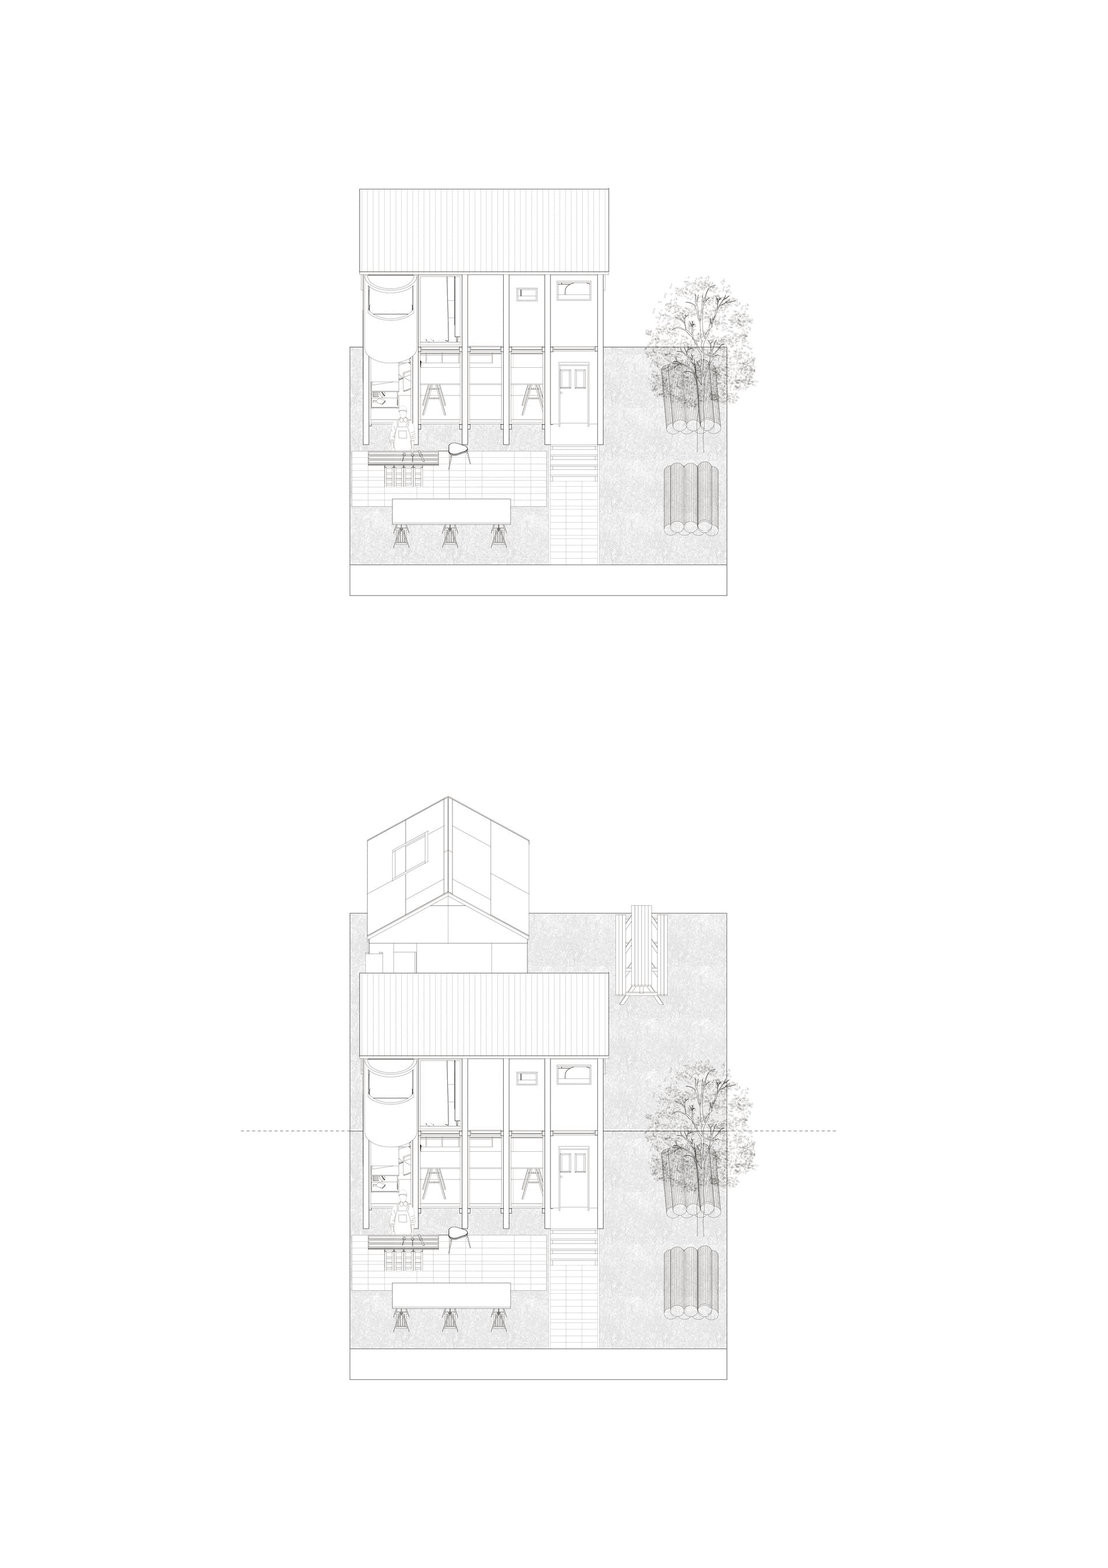
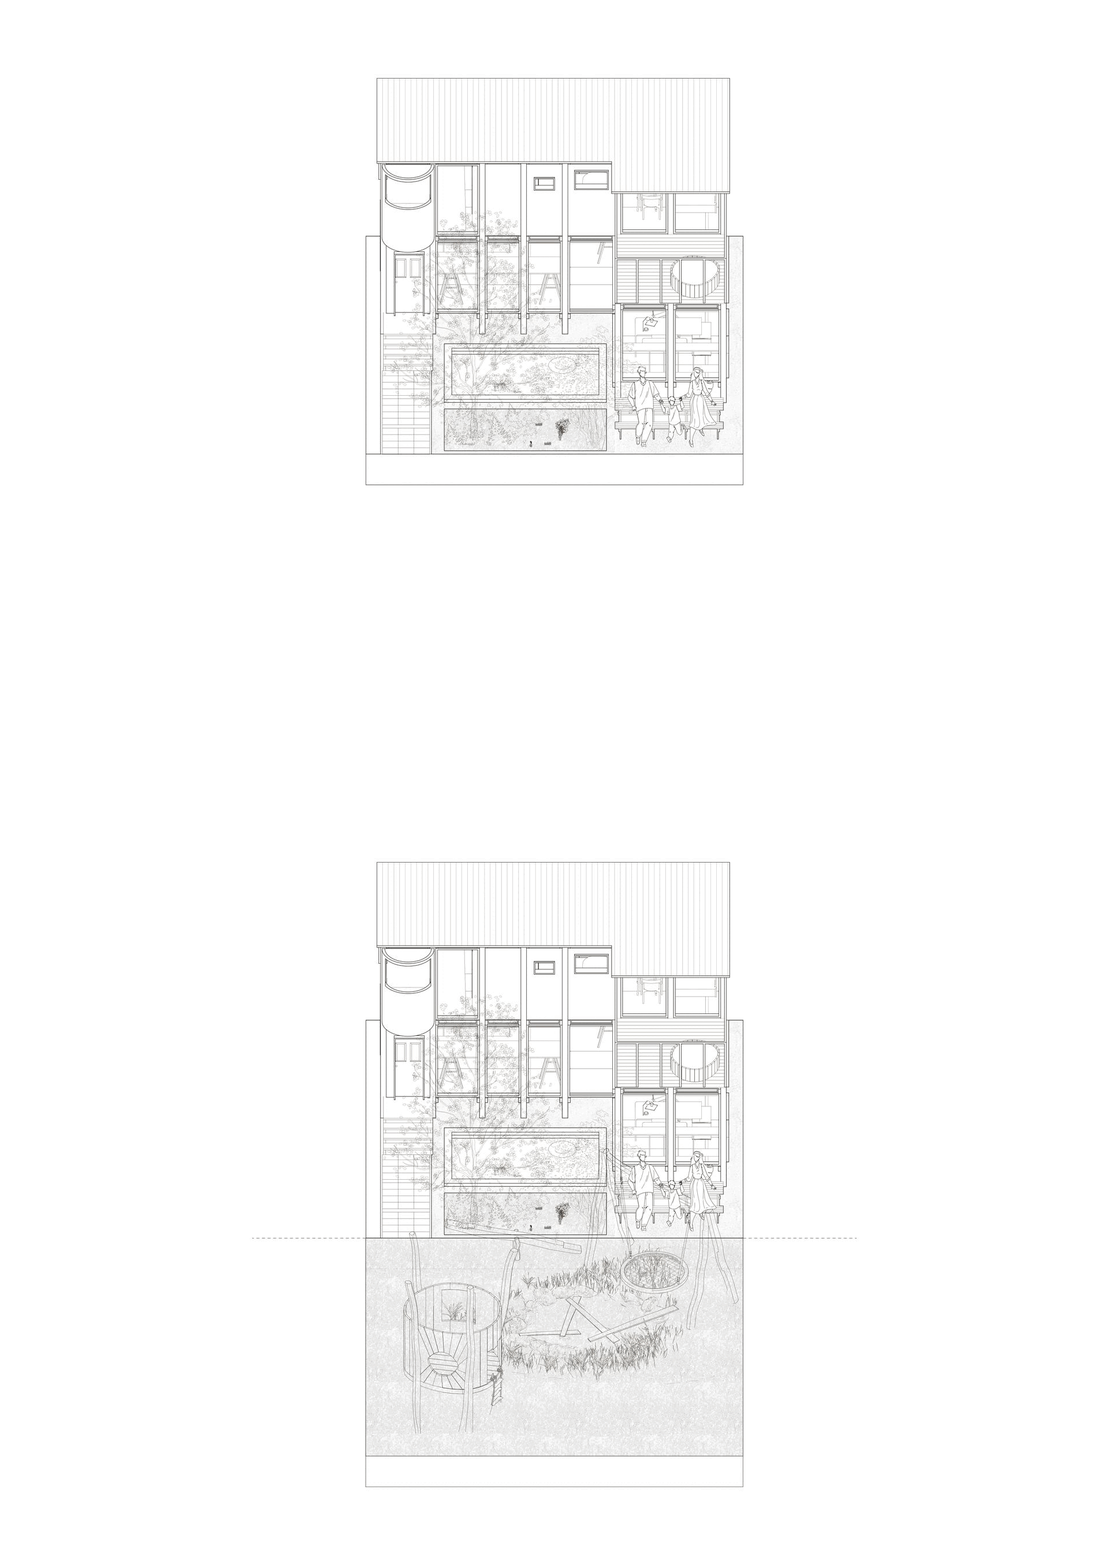
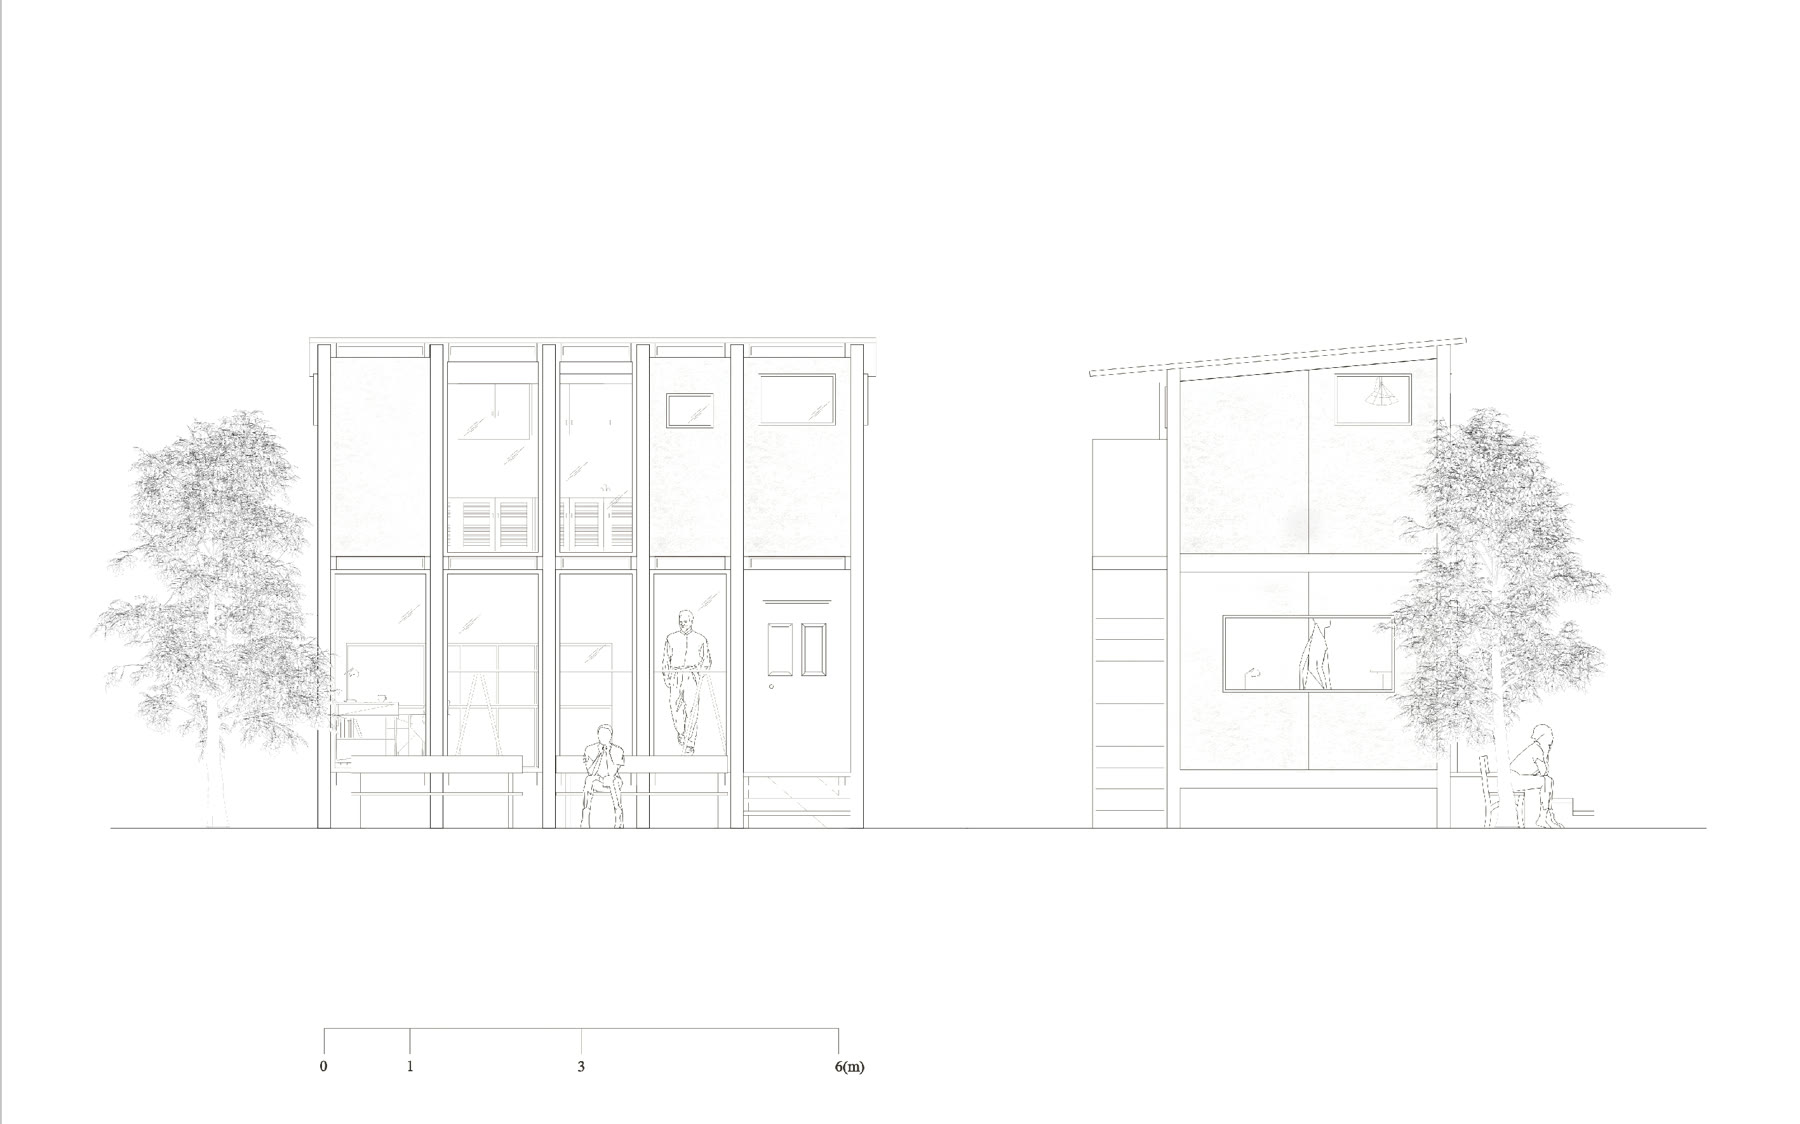
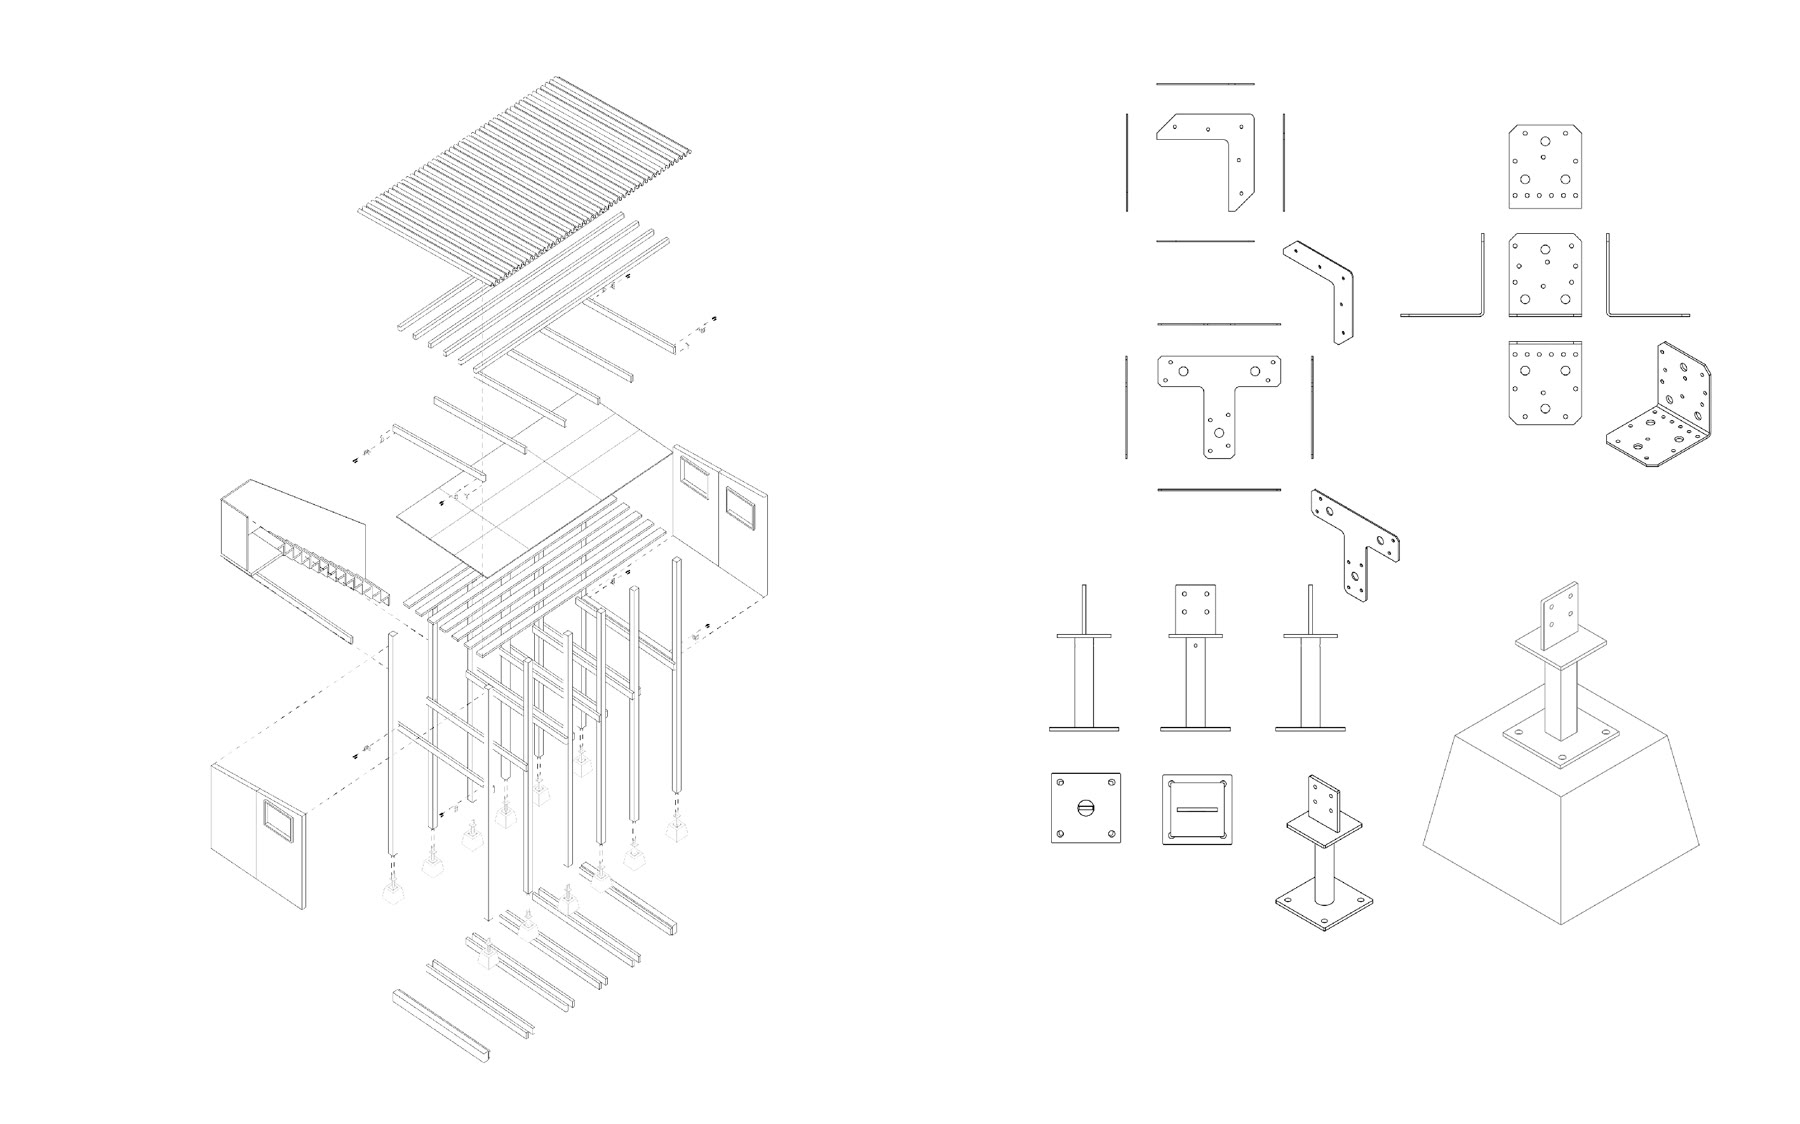
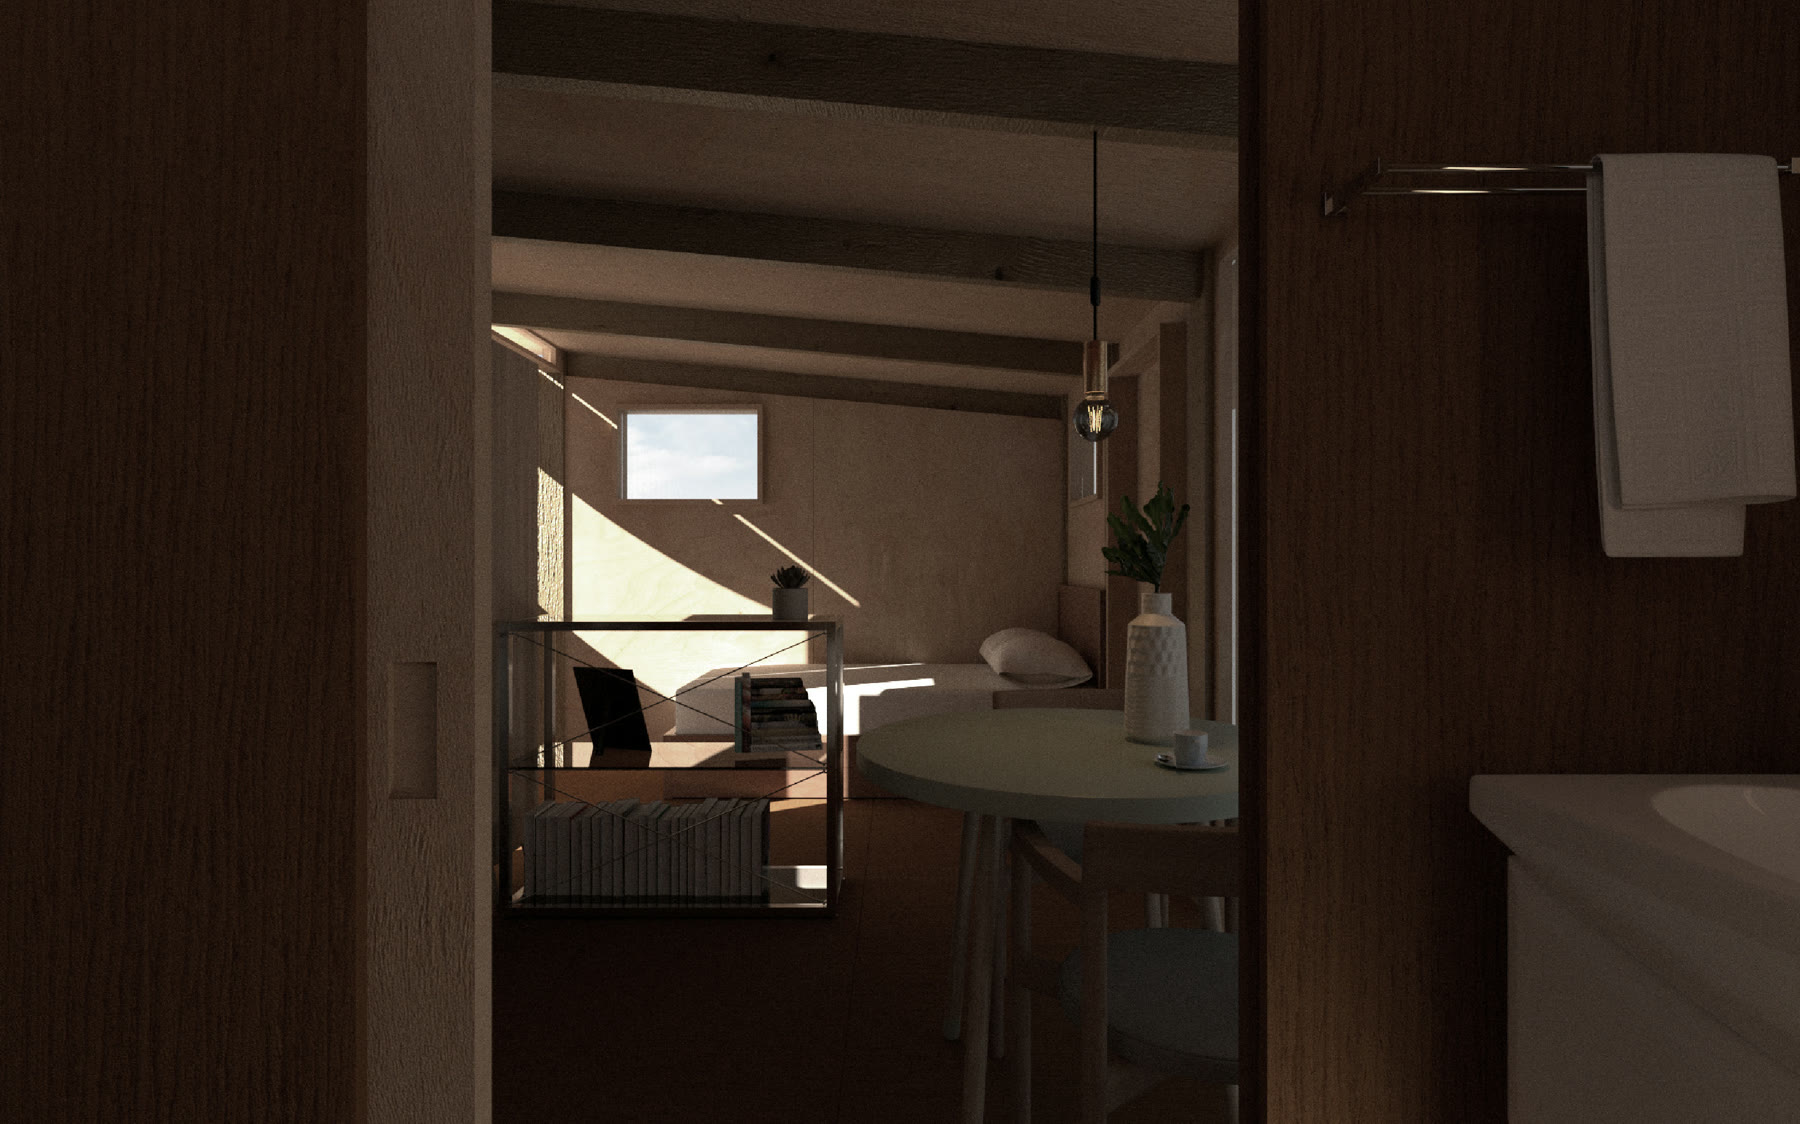
A custom map reconstructs estimated vehicle positions from TfL arrival forecasts. These changing conditions inform arrival pressure and a separate section-response index: a chain from transport information to drawn apertures, louvres, light and waiting commons.
The drawings and films explore how that response could become legible in public space. The current browser system uses explicit rules and modelled waiting, with its sources, assumptions and next tests set out below.
The current recommendation system is deterministic and non-learning. It enumerates complete two-cell bundles, removes options that violate declared constraints, compares the remaining alternatives through an ordinal priority structure and preserves exact ties for review.
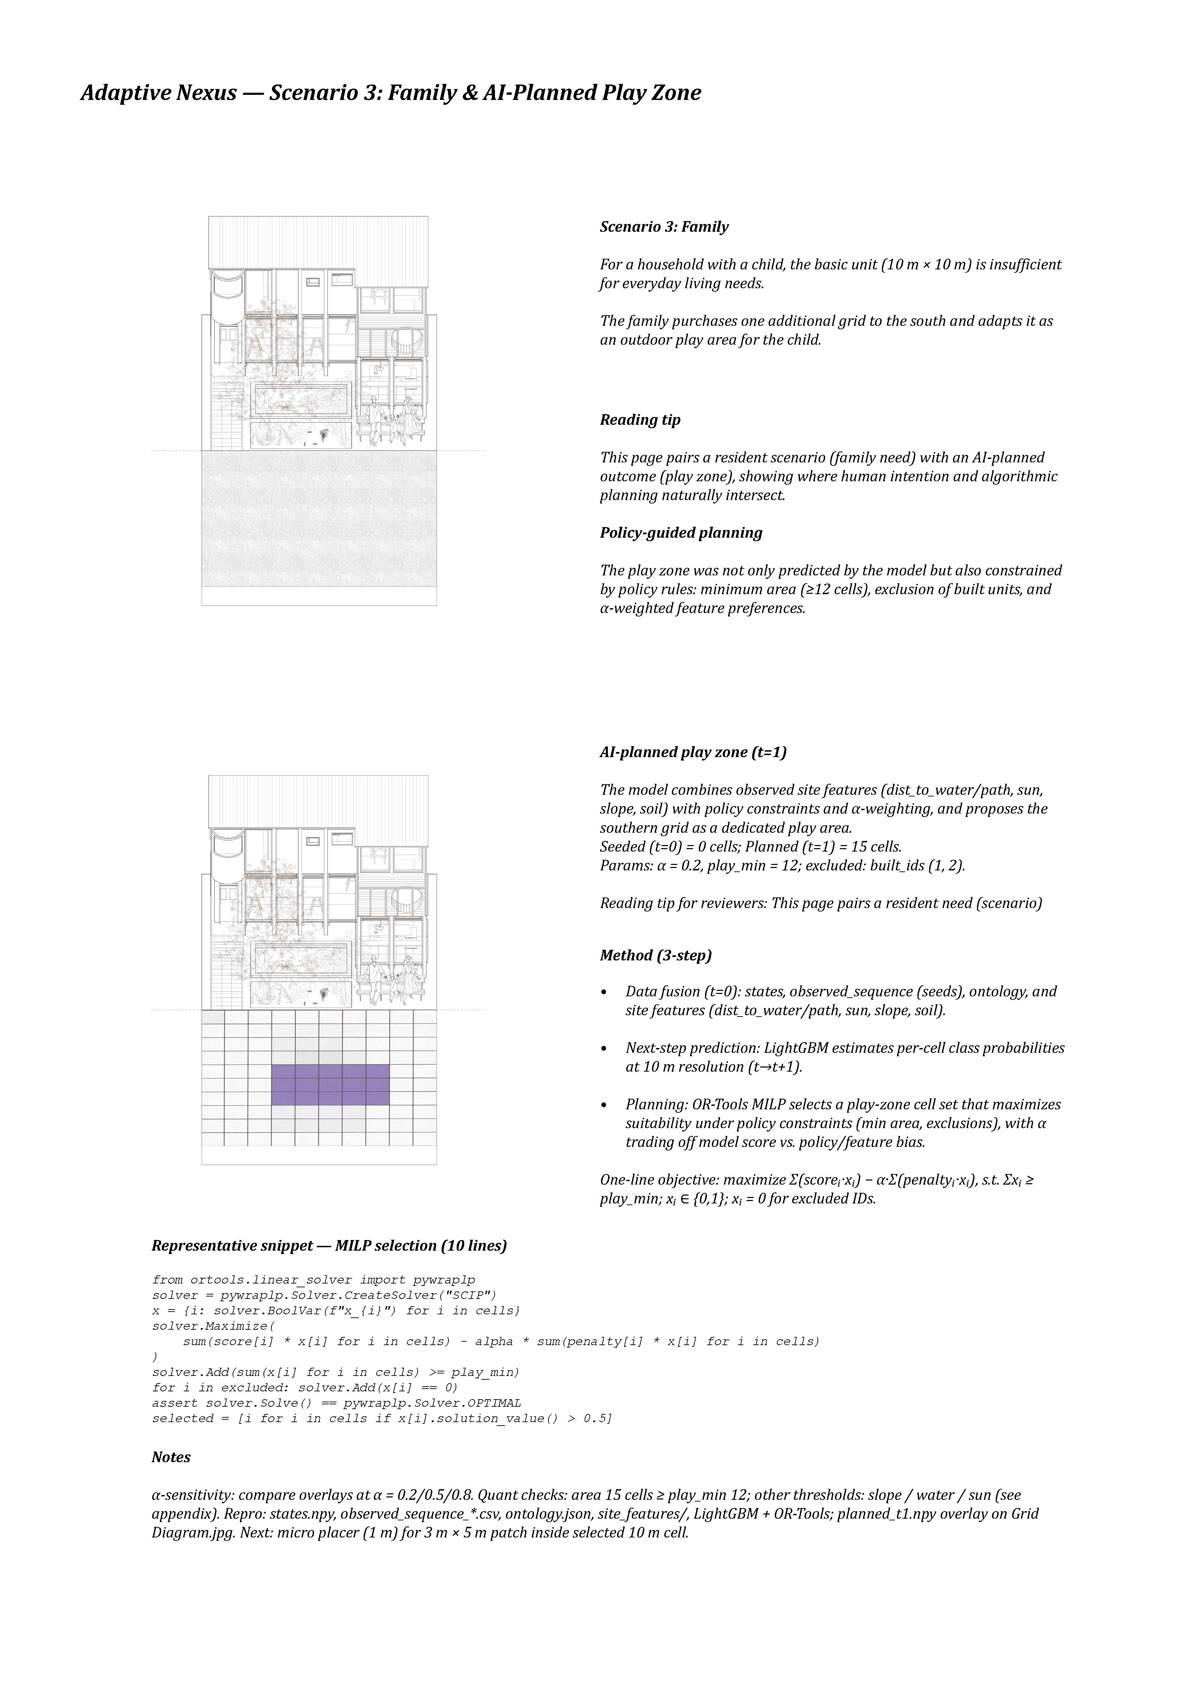
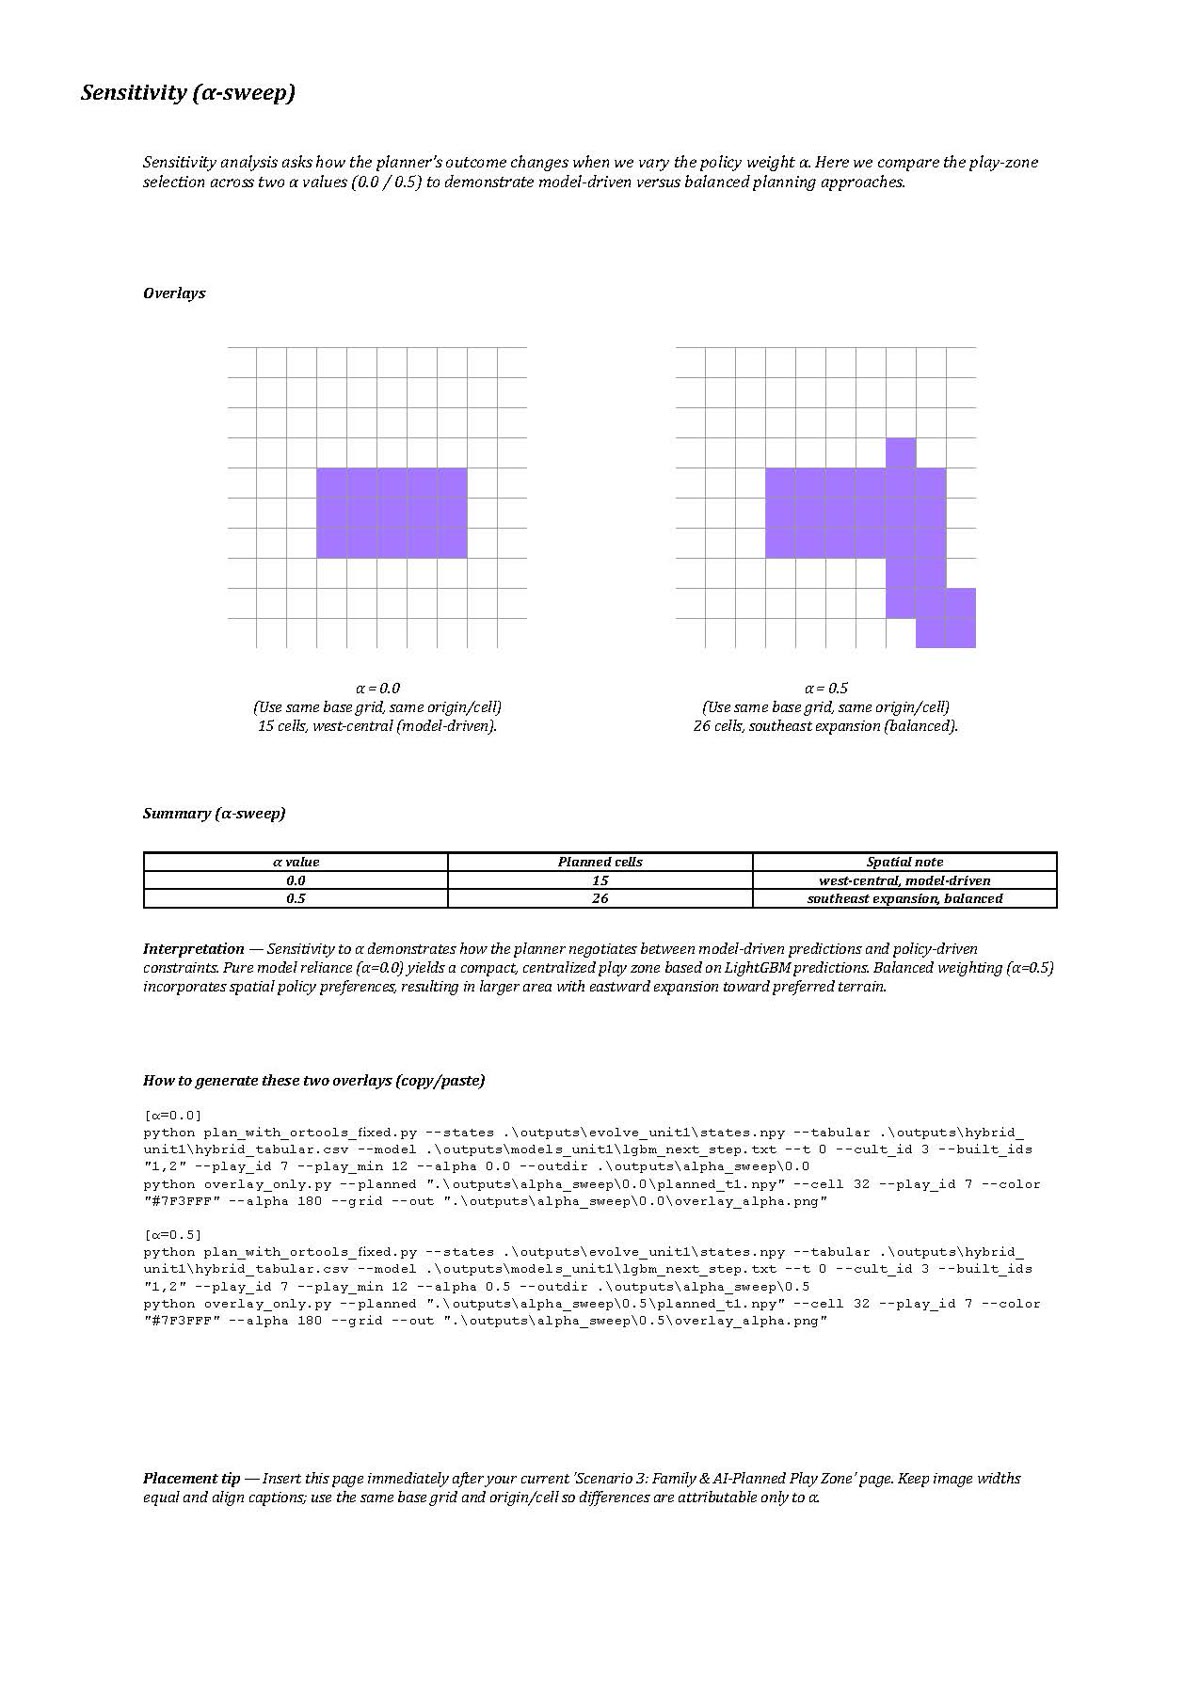
A separate historical prototype used LightGBM and OR-Tools to explore cell-level play-space planning. This earlier experiment is retained as a method test. Preference learning from anonymous visitor choices remains a future research phase.
Work in progress.
From data to movement.
Rain raises the fabric; sunlight opens a shading posture. Follow the rain paths and changing shade as arrival activity continues within it.
Explore both weather studies, or connect the map’s live AWI and current weather model.
Pulse Logic / Method & evidence
From arrival forecasts to public space.
Arrival forecasts become legible spatial responses through explicit estimates and rules.

- 01 / Inputs
- TfL arrival forecasts, reconstructed vehicle positions and modelled passenger loads and queues. Open-Meteo supplies modelled temperature; station-crowding responses are identified separately.
- 02 / Spatial response
- Explicit rules drive the drawn openings, louvres, light and waiting commons. The arrival-pressure map and section response use different indices, with their own stated scales.
- 03 / Current evidence
- A running browser demonstration and a separate offline experiment using design-generated labels. Crowd accuracy, ventilation, energy savings and built control performance have not been established by these demonstrations.
Two indices, two scopes
The live map uses a 15-minute arrival horizon. A forecast contributes vehicle weight × (1 − ETA / 900)^1.35, weighted by distance with exp(−distance / σ) and the selected radius cutoff. Bus weight is 1; tube weight is 2.6. Display scaling is min(9.9, raw × 0.42), a design convention rather than an empirical calibration. One vehicle can have predictions at multiple stops; this is not a unique-person or unique-vehicle count.
The section response index combines modelled queue/load, tube and bus ETAs, available station crowding and a temperature modifier. Its 0–1 smoothing, minimum response floor and mode thresholds are design rules. It is not numerically interchangeable with the map’s AWI. No future-wave timing is presented as a validated forecast.
Source time, receipt and failure
The transport engine polls every 15 seconds; the pressure map every 20 seconds. The freshness guard is two poll intervals plus a 12-second request timeout. A failed or partial source cycle holds the last drawing explicitly. Without a complete response there is no current value. A successfully received empty forecast list is distinct from failure. Station-crowding requests run on a separate five-minute cycle.
The section’s embedded films are recorded illustrations. Its current source pipeline does not analyse those videos. Earlier video-detection studies remain part of the project’s history.
Next independent test
Record actual aggregate arrivals or waiting in fixed intervals, with collection method and missingness. Archive the forecast version available before each prediction. Compare with time-of-day and persistence baselines using chronological train, validation and test blocks. A mode classifier fitted to the project’s own rules tests rule imitation, not the truth of those rules. Assess architectural control effects separately in independent trials or explicitly labelled simulation.