Can people with different scent needs share a room? Spatial design offers more seat choices; machine learning previews how ventilation changes exposure at each place.
The current computational study is complete within its stated scope. Physical and perceptual validation remain future work.
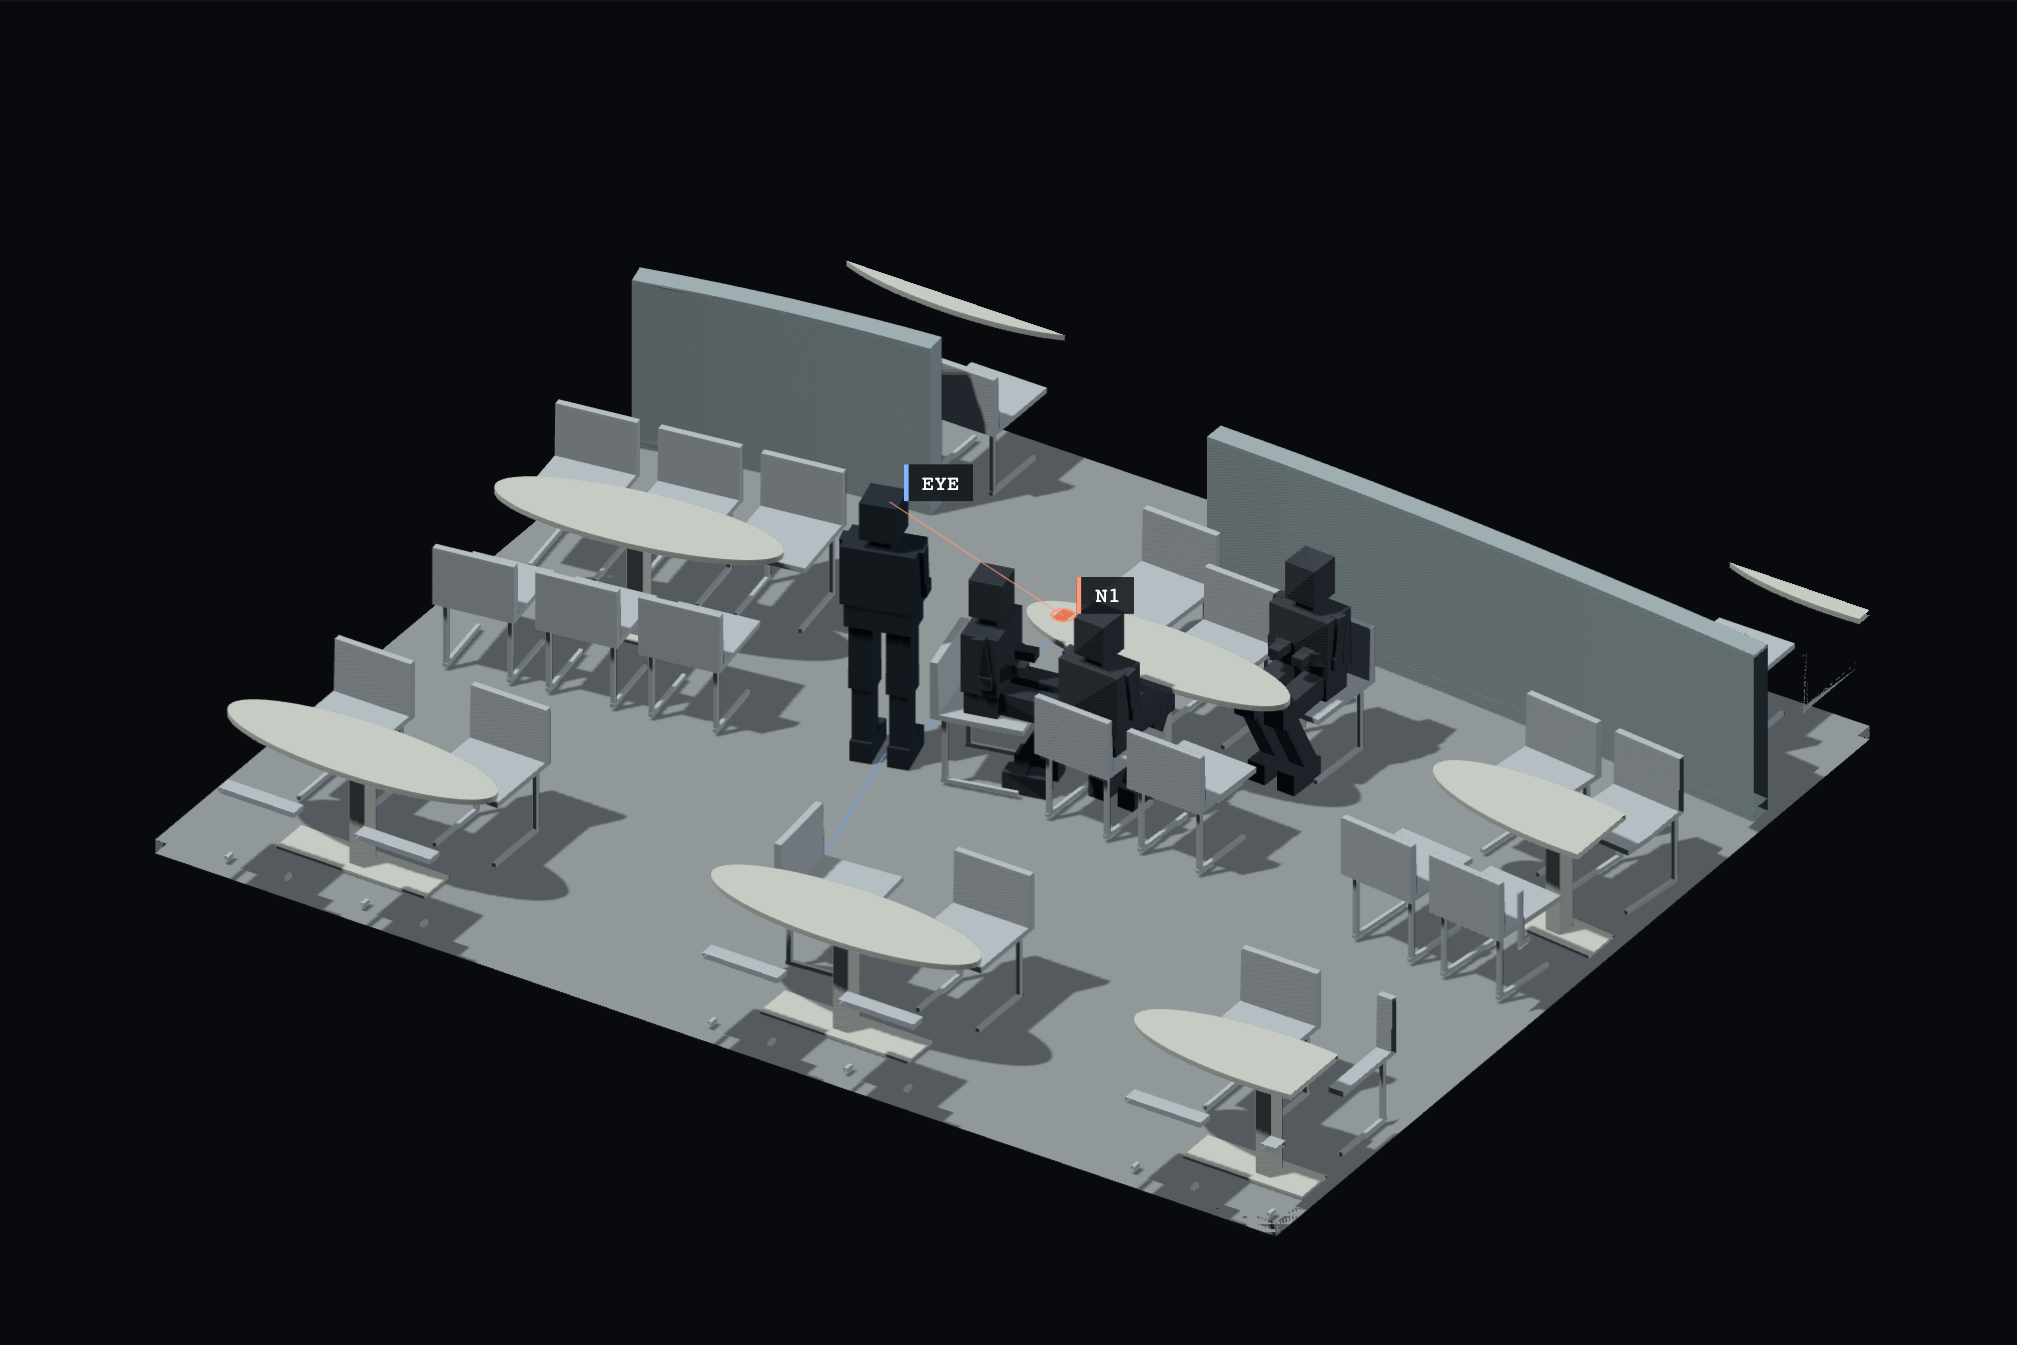
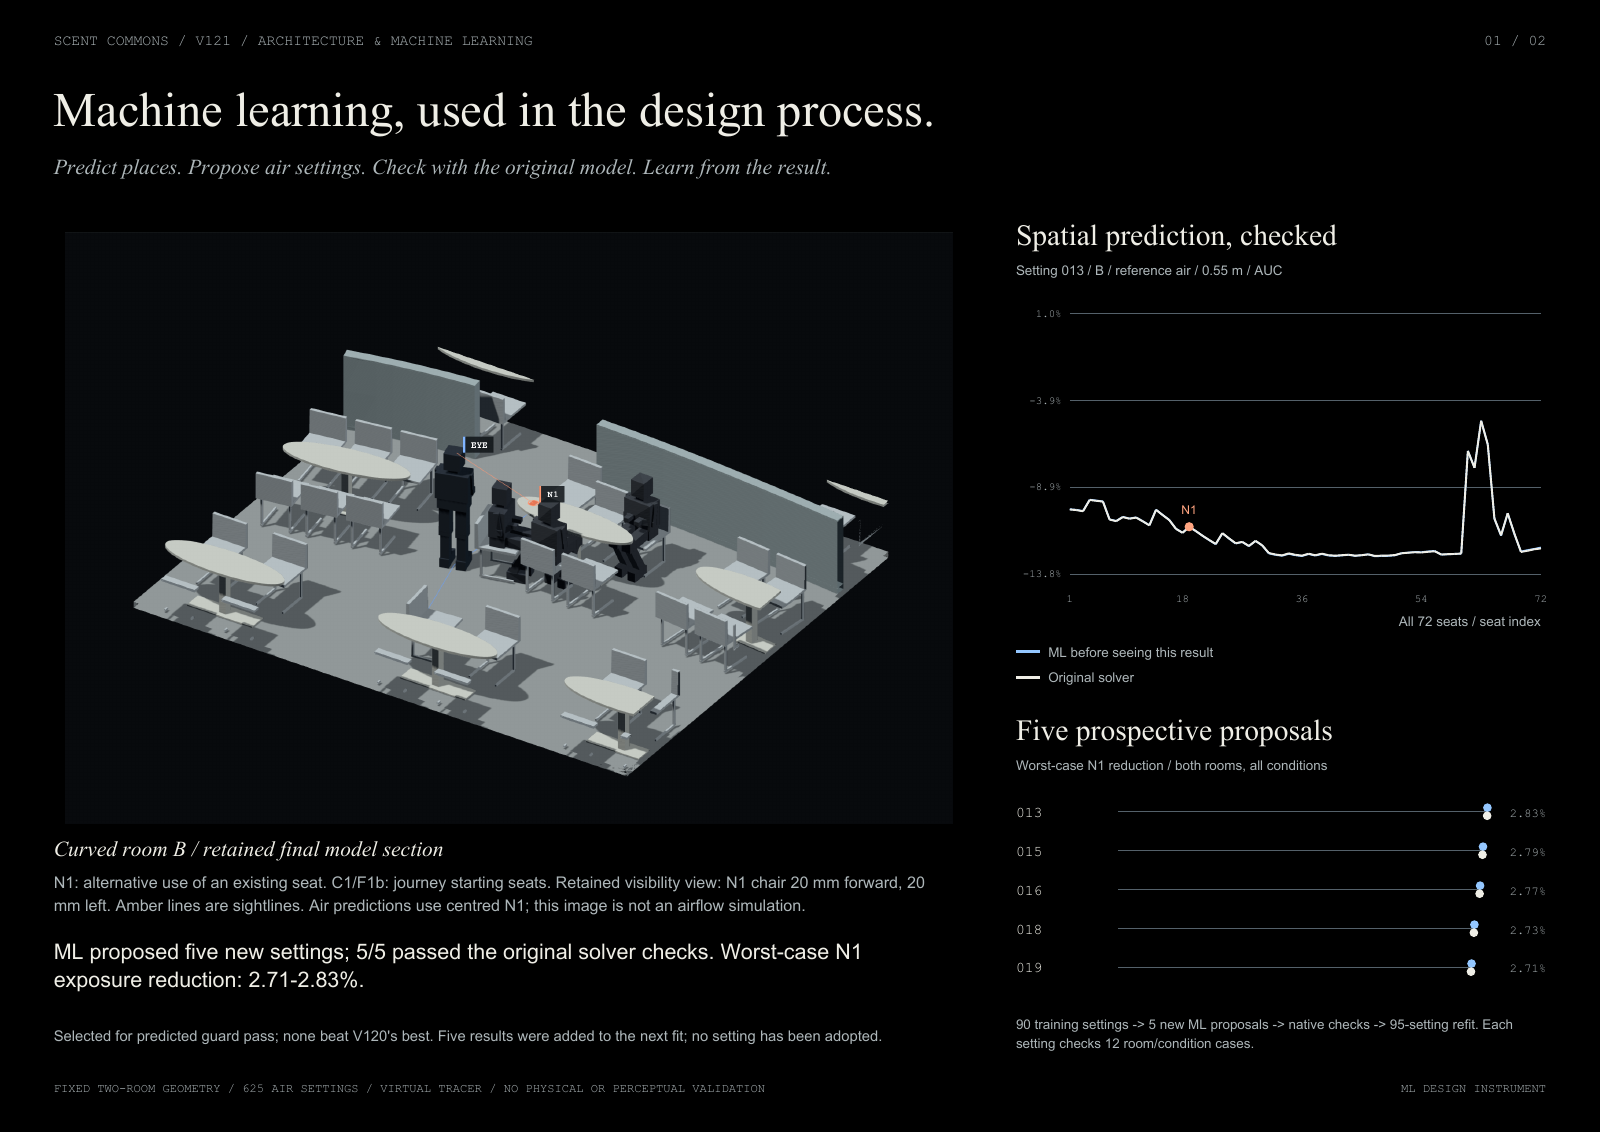
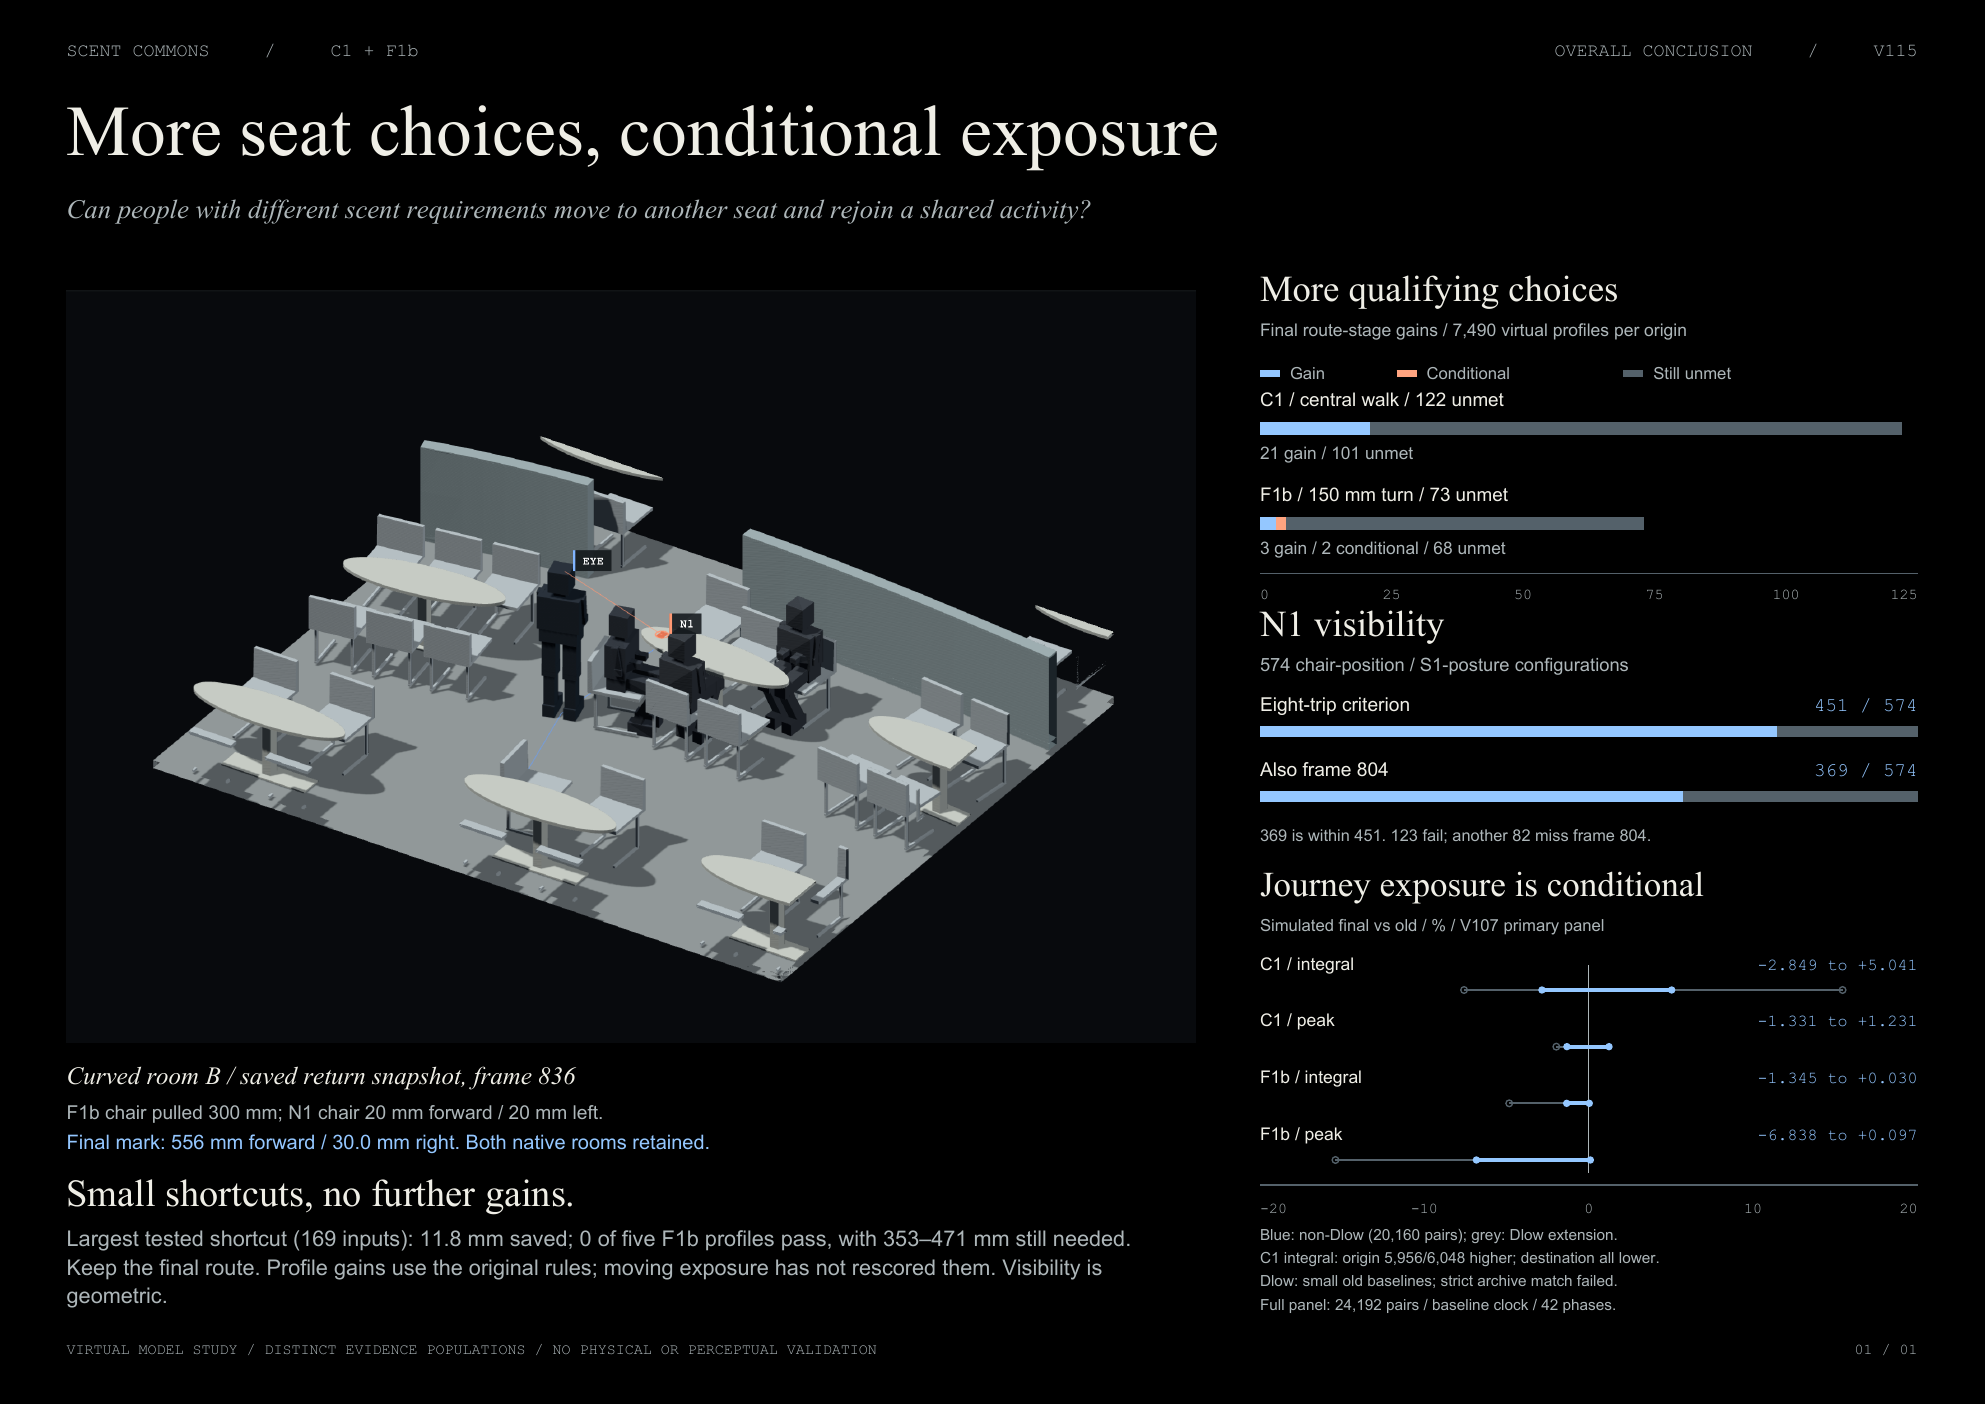
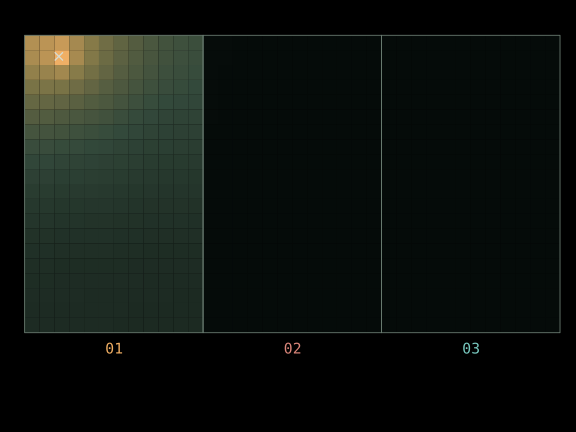
C1 is the shared table; F1b is the second table and departure seat; N1 is the alternative seat reached from F1b, with a tabletop visibility mark. Both the straight and curved room models contain 72 seats.
7,490 virtual profiles per origin. Separate stage baselines: C1 122; F1b 73 before the 150 mm turn change. Blue: gained; peach: conditional; grey: unmet.
Chair/posture configurations, not people. 369 also pass frame 804 on all four broader-body trips.
Virtual model results. Profile gains, visibility configurations and exposure comparisons are separate; physical smell and sign recognition remain unvalidated.
MACHINE LEARNING / TWO 72-SEAT ROOM MODELS
Learn the exposure. Propose a setting. Check it.
Original simulations supplied 90 training settings. ML learned how four ventilation controls change exposure at individual seats and along retained journeys, then chose five new settings for the original solver to check.
All five met the numerical protection rules. They were selected because ML predicted they would pass. On a separate 40-setting test, the updated model's mean spatial error was 0.018 percentage points of baseline exposure. The five proposals were closely related and did not beat the previous best design.
The public comparison shows seven saved examples. The local research instrument runs the learned model and explicit new solver checks. Simulation-derived exposure, not measured smell.
THE WHOLE ROUND TRIP / SIMULATED EXPOSURE
A shorter route changes when and where exposure happens.
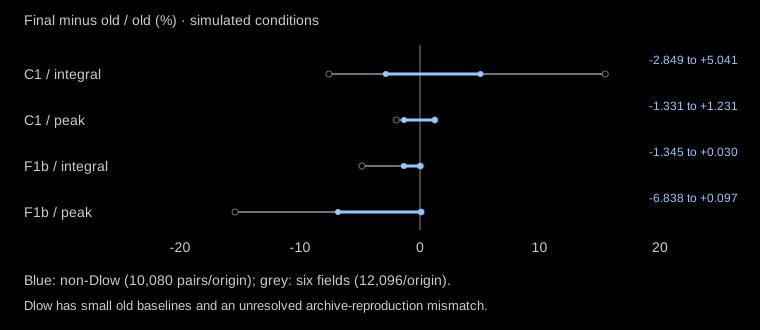
The final routes provide more seat choices under the original model rules. Tracking exposure along the complete trip adds a separate finding: cumulative exposure and peak exposure can move in different directions.
Where saved time is spent matters. In the displayed C1 panel, all destination-spare integrals are lower; 5,956 of 6,048 origin-spare integrals are higher. This is a scheduling assumption, not observed behaviour.
Matched old/final observation times. Finite model ranges, not uncertainty bounds or perceived-smell measurements. Dlow retains an archive-reproduction mismatch.
ROUTE LIMIT / SMALLER ROUTES
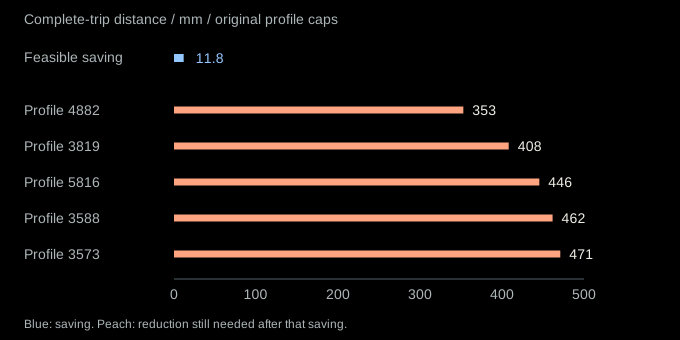
11.8 mm saved. No further profiles qualify.
Among 169 tested inputs, the largest shortcut keeping all previous visibility passes saves 11.8 mm. The five closest F1b profiles still need 353–471 mm less travel in their worst saved contexts.
The larger half-metre shortcut meets their travel budgets but fails the unchanged N1 visibility-duration count (287 against 306 frames). The final route stays. Movement caps and the N1 mark stay fixed.
Same 451 main and 369 nested visibility identities retained. Each of the five profiles passes 0 / 2,952 contexts. Discrete tested inputs, not a global shortest-path result.
VENTILATION DECISIONS / ORIGINAL THREE-ROOM MODEL
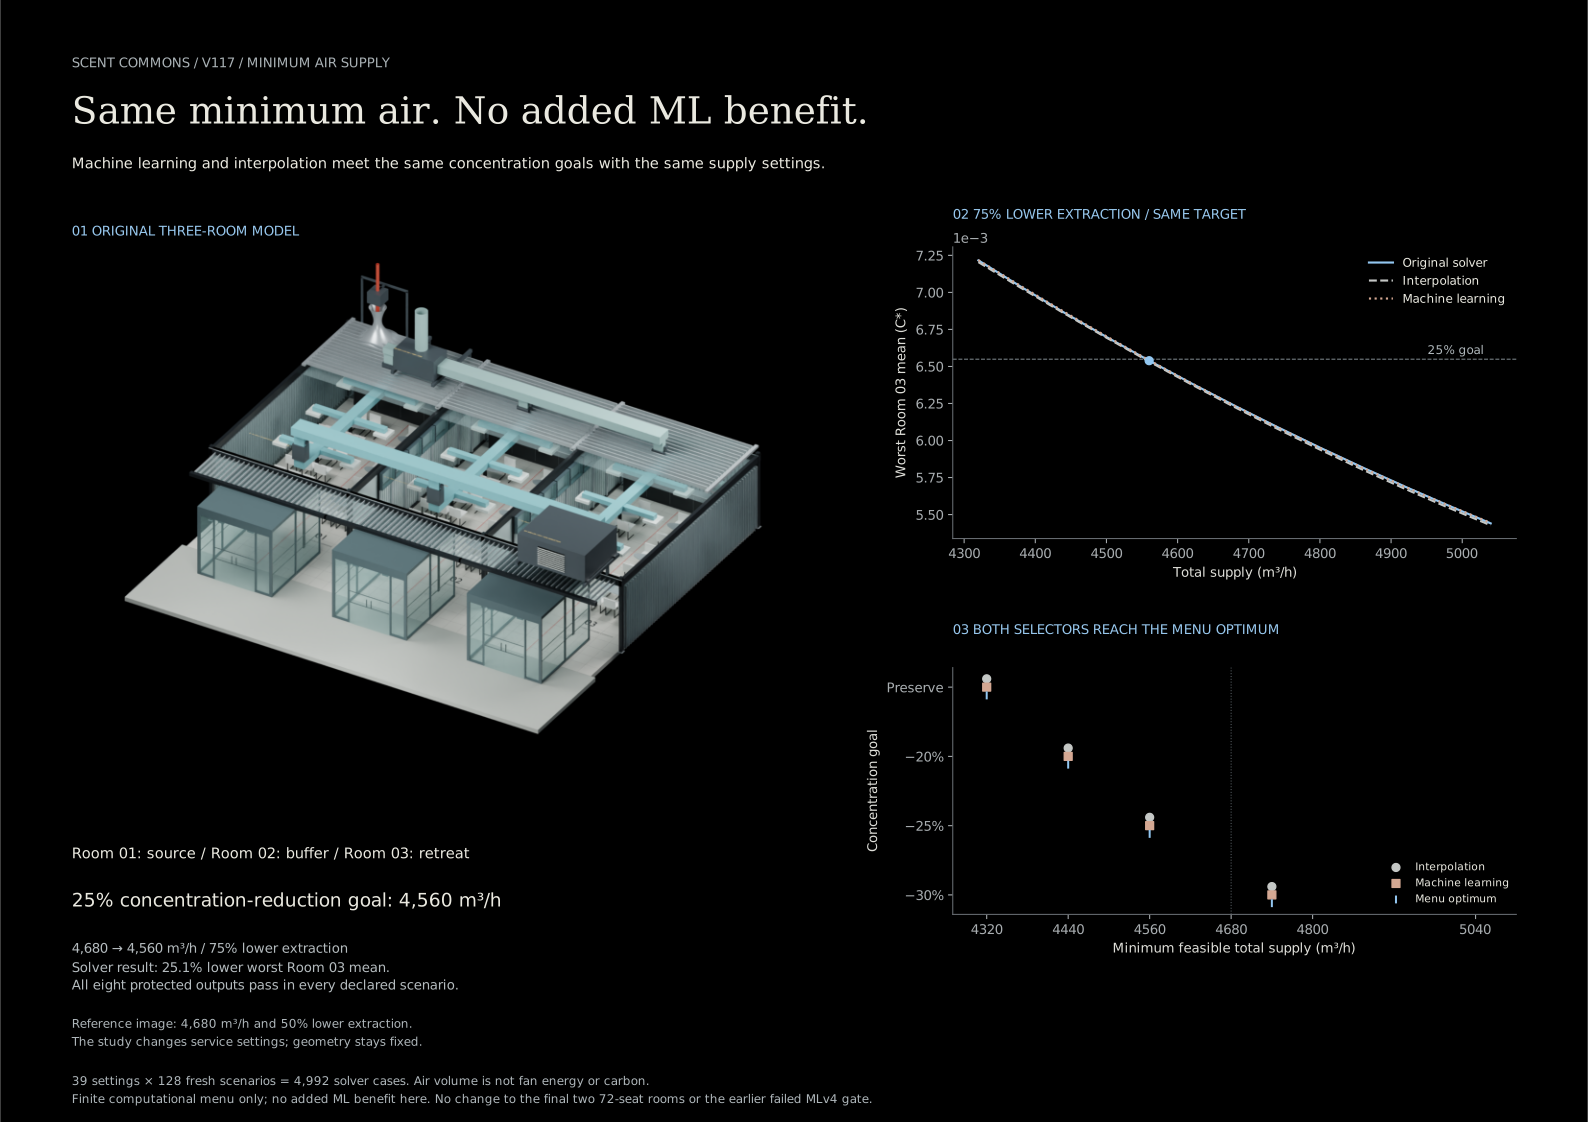
Earlier three-room test: the same choice with or without ML.
Simulator-generated data trained ML to predict room concentrations. ML and interpolation predictions each ranked ventilation settings, which were then checked in the original simulator.
At 4,680 m³/h supply, drawing 75% of general extraction from the lower layer reduced the worst Room 03 mean by 28.5%. ML, interpolation and a simple 75% rule chose the same setting.
A separate minimum-air test met the reference target with 7.7% less supply air. ML and interpolation again made identical choices. These percentages come from different tests; they are not a combined improvement.
Separate from the final two 72-seat rooms. Model concentrations, not measured smell. Lower supply volume is not an energy-saving result. Read the primary result and tie-rule caveat.
C1 + F1b / RESEARCH CONCLUSION
More choices, with the remaining limits visible.
The final route gains above use separate stage baselines. Earlier airflow and chair changes are traced in the evidence map. Neither the two origins nor the marker configurations are added into one human success rate.
PRIOR FIXED-GEOMETRY / PERSONAL DEMANDS AND SHARED ACTIVITY
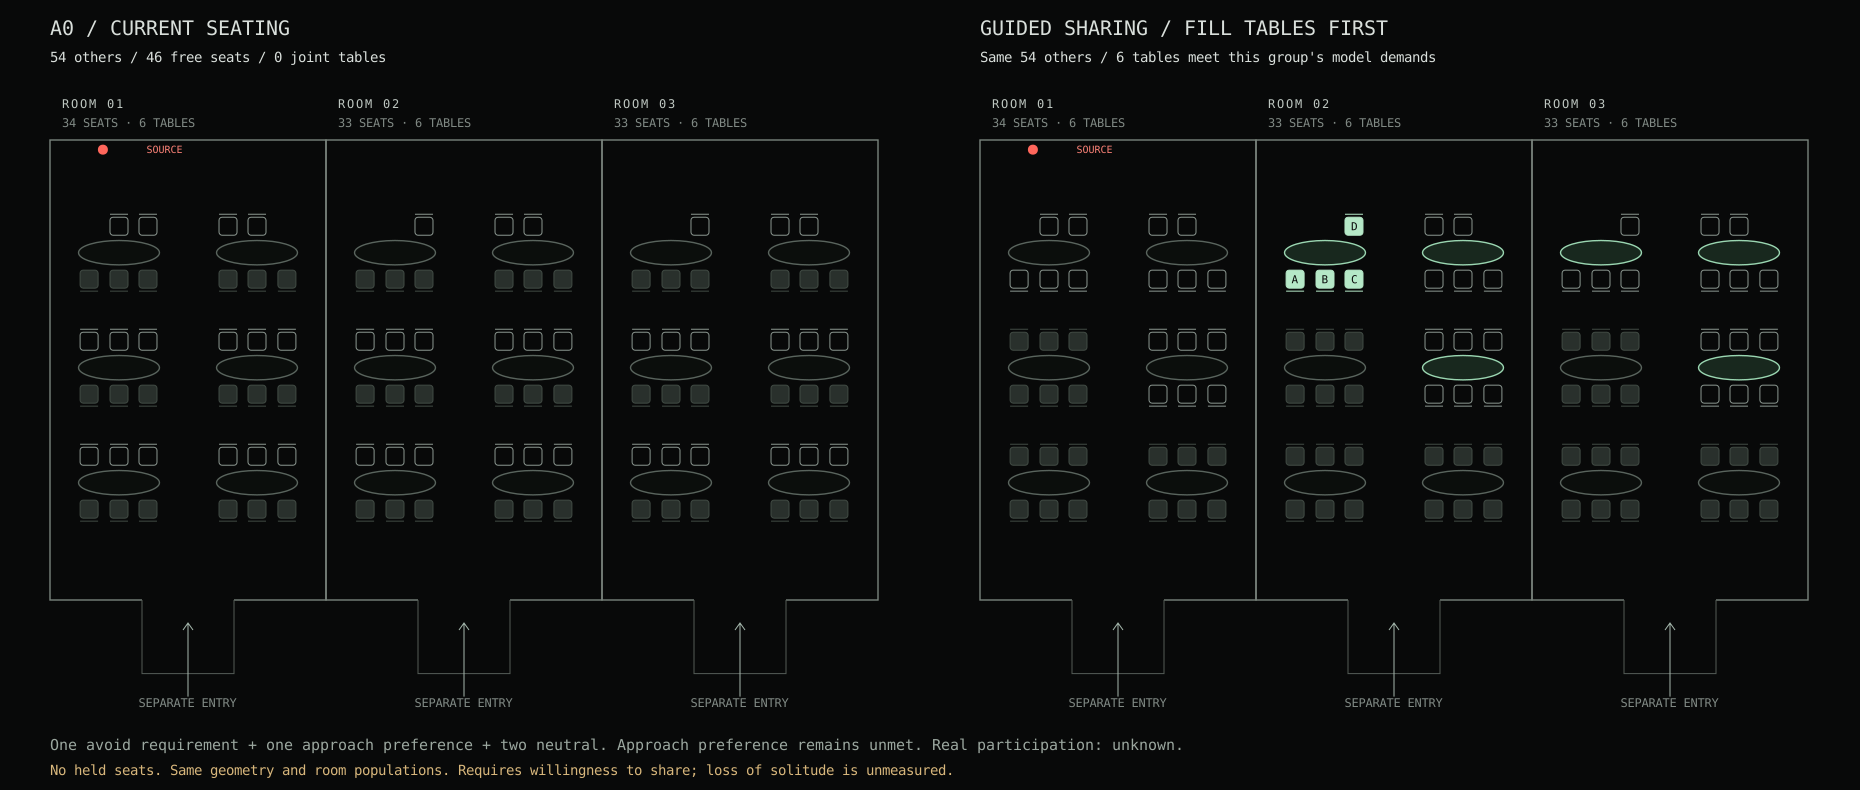
100 seats. One place for all four?
The research now asks whether people with different explicit scent demands can stay together to read shared material and talk. A person having somewhere to sit does not establish a place for their group. The current 100-seat Rhino plan is tested before changing any boundary.
Current scattered seating vs guided sharing: no held seats, unchanged furniture and air model. Sharing may conflict with wanting to sit alone. The approach preference remains unmet; no required demand is relaxed. Reservation remains a separate comparison in the study.
WHAT THE CURRENT PLAN CAN DO
18 existing tables can seat four.
With no other occupants, six tables meet the example approach band and twelve meet the default avoid band. At the stricter 0.001 band, the primary lower-layer metric loses all avoid candidates in the two wind cases, unlike the room-volume diagnostic. Under clustered occupancy there can already be room for groups. Guided sharing is a smaller operating candidate than reserving twelve seats; acceptance remains unmeasured.
WHAT REMAINS UNKNOWN
One table, different exposures.
Disjoint required compartment-average bands have no joint solution in this model, even when each person has an individual place. That is not evidence of physical impossibility at different seats. Local exposure, document visibility and speech remain unmeasured.
Model-stage decision: retain furniture and boundaries; consider guided sharing before holding seats. That prior recommendation is retained as history; the current digital A/B/C study is linked above. Four direct P10 cases compare lower-layer means with room-volume means; 896 paired scenario comparisons and 351 exact capacity cases check the seating logic. This is explicit constraint matching, not behavioural learning.
Tea preparation is a working program at the existing source location; the tracer is not a calibrated tea emission. Green in the study means stated model conditions are met, not predicted happiness, comfort or safety. The historical preference tests, transport studies, failed guards and four ML experiments remain below.
Graph model · 60× · uncalibrated
01 / RESEARCH QUESTION
Can a shared space accommodate different scent preferences?
The starting point was difference between people. Public odour ratings offered a way to test preference models before buying sensors or running a field experiment. The architectural question became where a person could stay, move or leave.
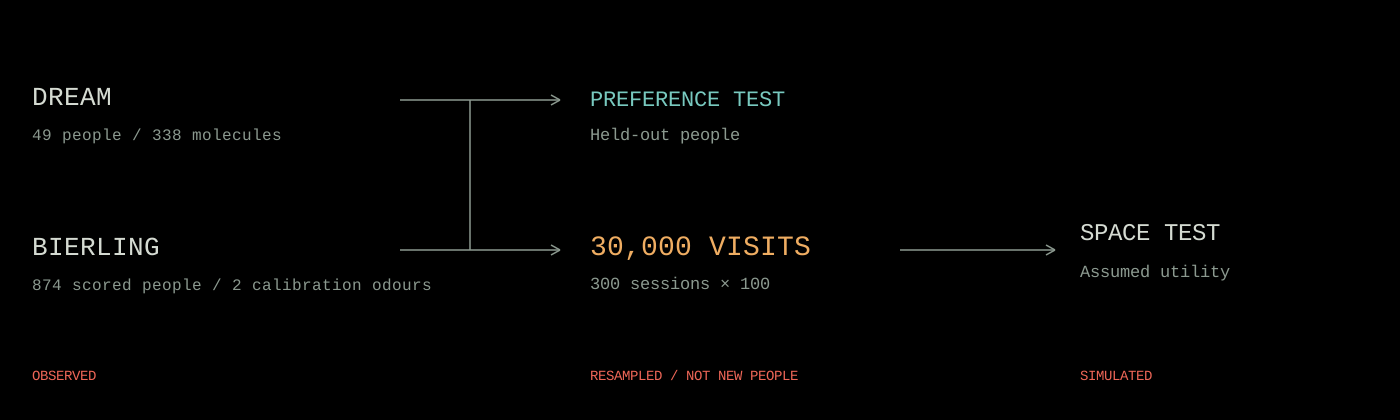
Observed ratings → preference tests → resampled visits → spatial scenarios. Each step has a different evidence status.
OBSERVED / DREAM
49 people. 338 molecules.
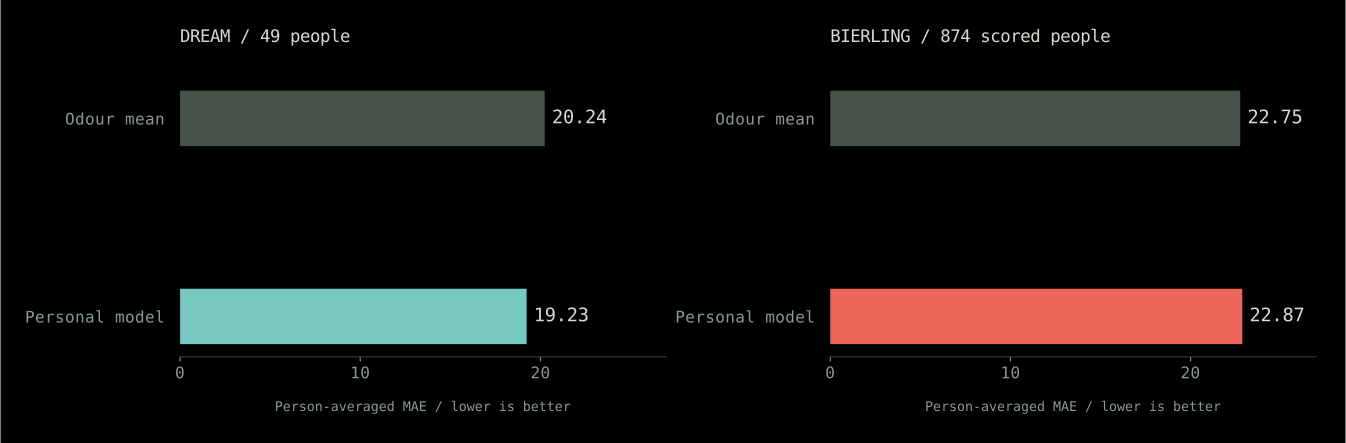
The local training subset supports a held-out-person benchmark using 30 designated calibration odours. A personal offset reduced rating error by about 5%; average ranking did not improve.
Of 894 people in the local training split, 874 contributed scored responses. With only two shared calibration odours, personalisation did not beat the odour-mean baseline.
Separate person-held-out benchmarks. Protocols differ between datasets; their errors are not pooled. These are rating predictions, not predictions of comfort in a room.
874 → 30,000
Resampled visits, not invented people.
Observed Bierling ratings were reused in 300 sessions of 100 visits. Arrival order, capacity and movement generated different scenarios. Repeated visits do not create extra independent training subjects.
The initial data survey also inspected 180 UCI gas-sensor trials and 448 Smell Pittsburgh reports. They helped define the limits of public data; neither supplies the preference labels or indoor concentrations used in the spatial comparisons.
02 / EARLY SPATIAL STRATEGIES
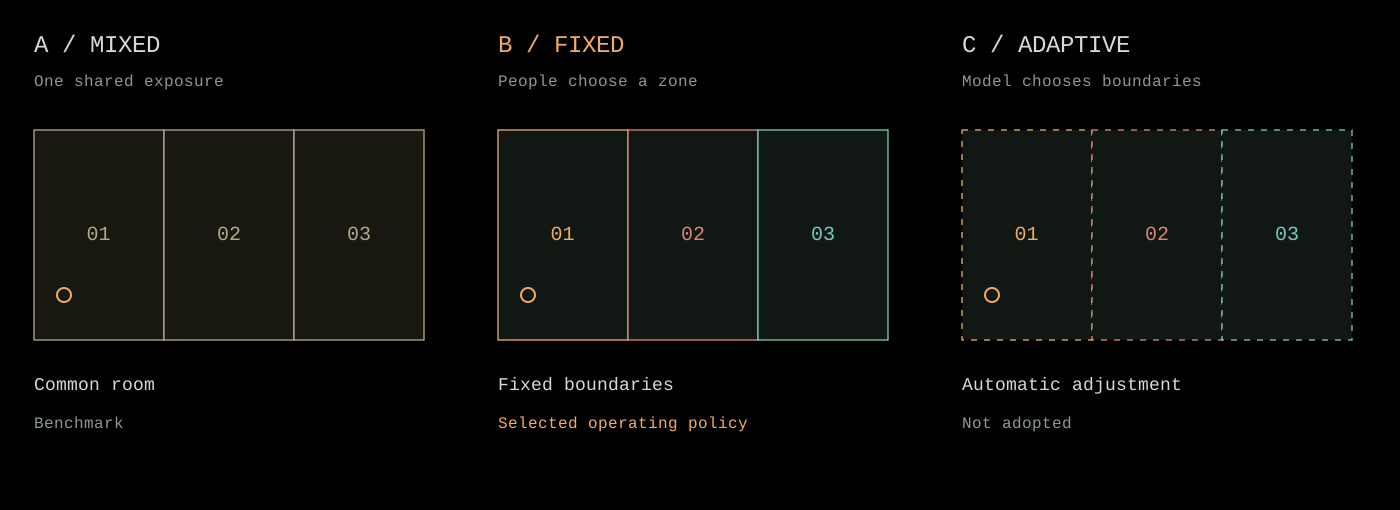
Why the boundaries stay fixed.
The first comparison tested a mixed room, fixed zones and automatically adjusted boundaries. It used the same resampled visits and an assumed relation between liking, exposure and utility.
Historical concept models at 540 m³/h total outdoor air. These strategies explain the operating-policy decision; they are not the current ventilation design.
THE TEST
Protect the lowest-scoring 10%.
C could move a boundary only when predicted scores satisfied a lower-tail guard against B. When evaluated using the observed odour ratings in the same utility model, protection still failed in 2 of 300 base-case sessions.
THE DECISION
Keep B. Leave adjustment manual.
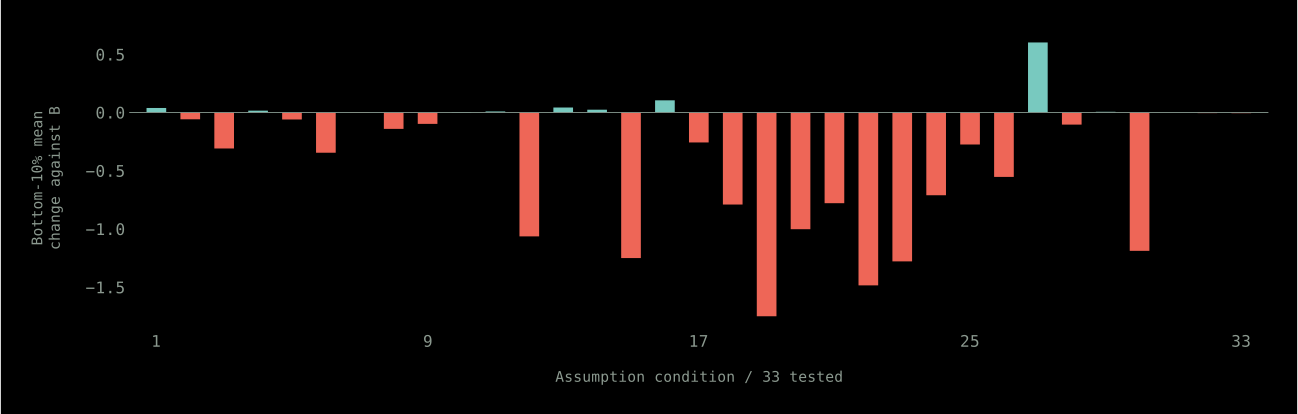
Across 33 assumption conditions, constrained C fell below B’s pooled lower-tail score in 23. Automatic boundary adjustment was therefore not adopted. Choosing B preserves its baseline by identity; it does not prove real-world protection.
Constrained C minus B, evaluated with observed-rating-derived utility. Below zero means the pooled bottom-10% average is worse. This historical model is kept separate from the later 4,680 m³/h retest.
03 / ARCHITECTURAL TRANSLATION
Three rooms, three ways to stay.
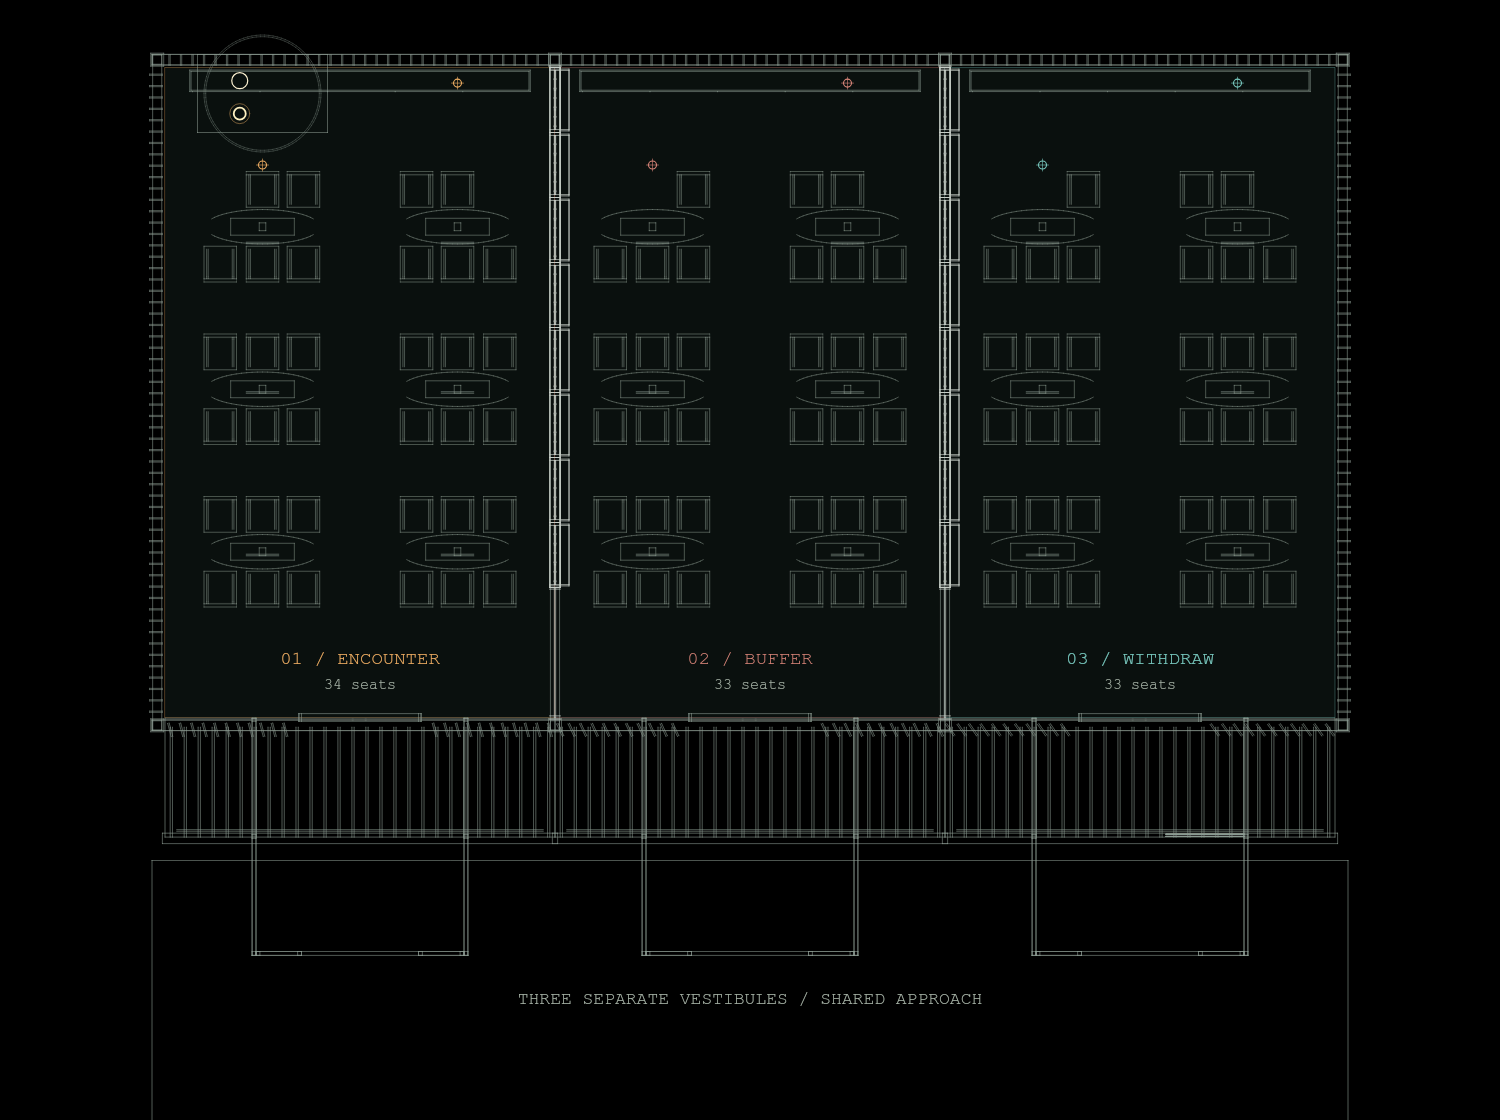
A 180 m² commons is divided into three 6 × 10 m rooms with 34 / 33 / 33 seats. Fixed boundaries, separate vestibules and a shared external approach allow withdrawal without a compulsory route through the scent activity.
Current Rhino geometry, redrawn as linework. Entrance vestibules are outside the 180 m² room area. Furniture and access remain a research layout.
01 / ENCOUNTER
Approach the activity. The only scent source and local extract.
02 / BUFFER
Share the commons at a lower modelled exposure. A proposed place to remain nearby.
03 / WITHDRAW
Choose more distance and separate access. Low exposure does not mean odour-free.
The room roles are architectural intentions. The additional scent-only value of the third room remains an open question, tested again below.
04 / ITERATION THROUGH AIR AND ACCESS
A vestibule solved one problem and exposed another.
Entry studies compared open access, changes to movement and separate vestibules. Reducing transfer could also retain more tracer in the source room. The next comparison therefore tested source-room concentration as well as spill into neighbouring rooms.
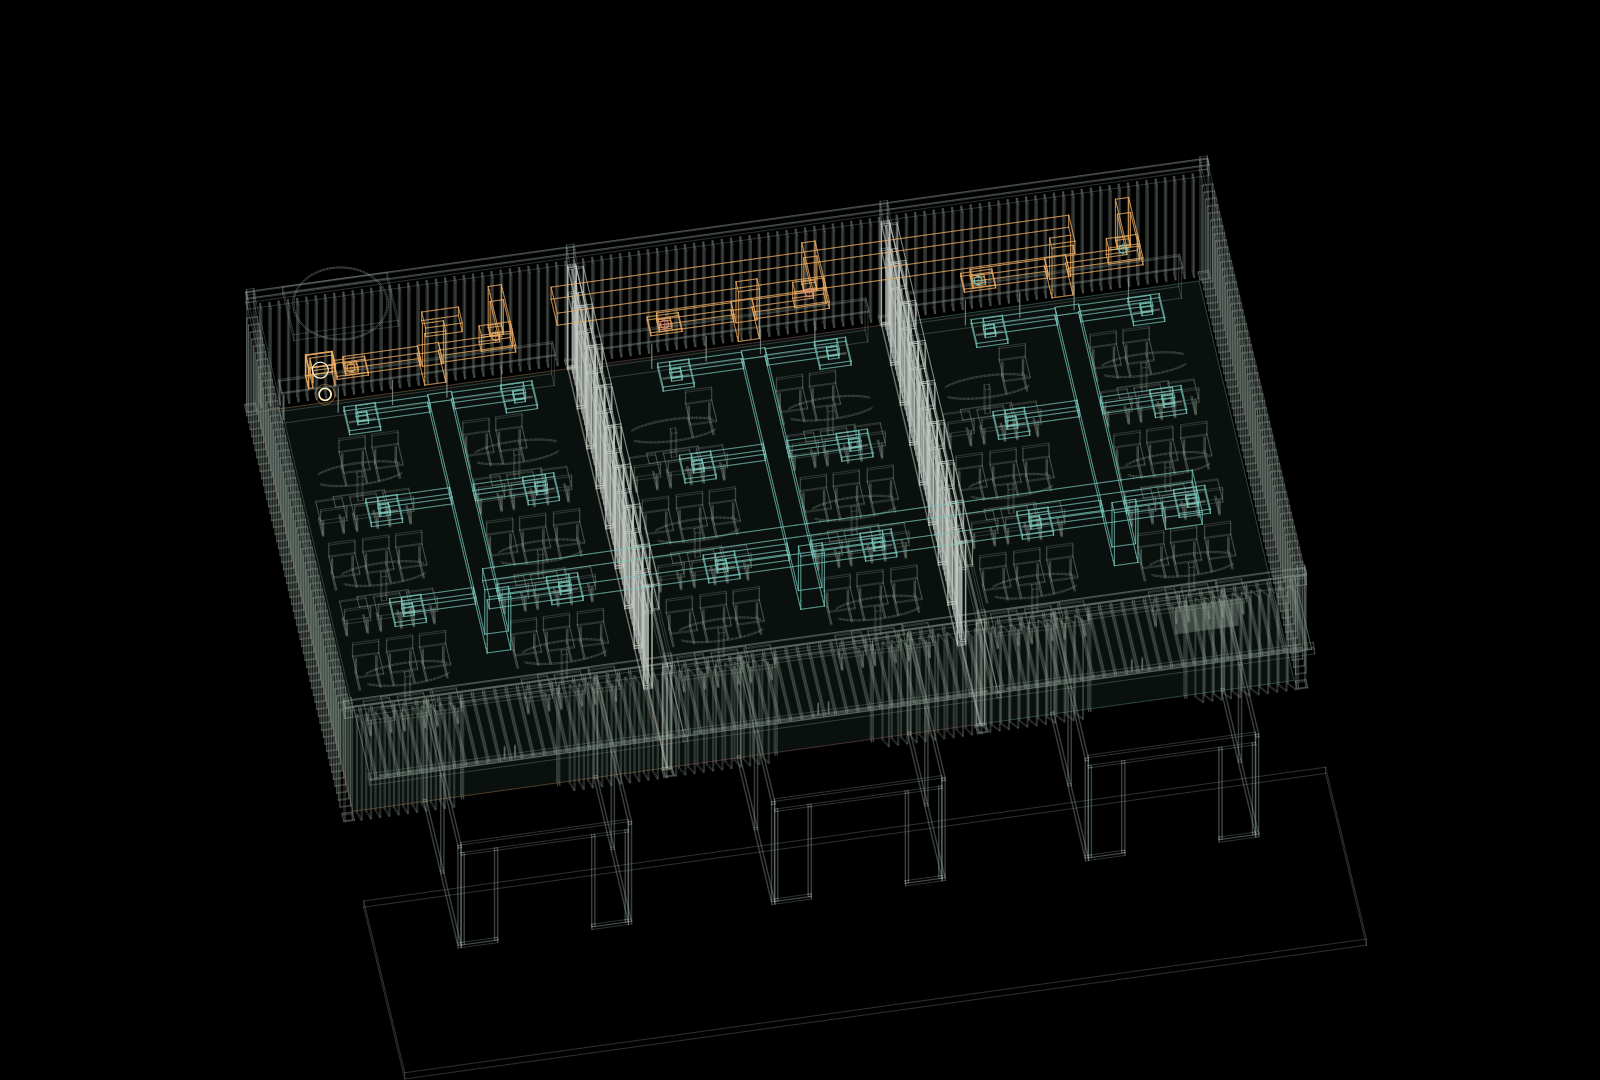
Current service and access layout. Green-blue denotes supply geometry; amber denotes extract geometry. The drawing locates components; it does not resolve a physical airflow field.
P10 / SELECTED RESEARCH CASE
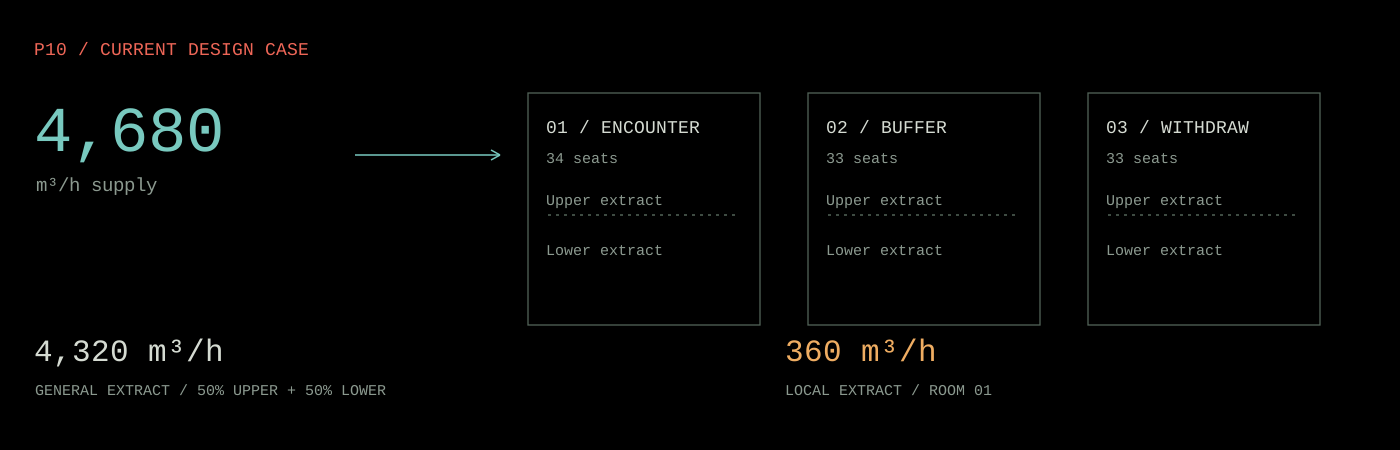
4,680 m³/h for 100 people.
Supply was increased by 30% above the study’s 3,600 m³/h baseline. At the lowest passing supply, P10 met the exposure and transfer checks in all 520 cases against both the earlier open-entry and first vestibule layouts. General extraction is split equally between upper and lower levels.
SOURCE CONTROL
360 m³/h local extract.
P6 passed at the same supply with 720 m³/h local extract. P10 retained 360 m³/h and required fewer component changes. The node model tests extraction heights, not hood capture efficiency or detailed horizontal relocation.
Supply = general extract + local extract. The extra airflow carries fan, air-speed and thermal-load implications. These are design conditions, not a commissioned building system.
One release. Three different timelines.
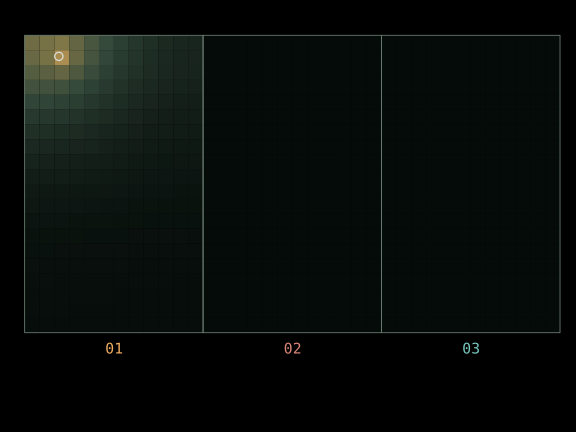
Concentration in plan · room mean C* below each frame.
02:00Release / source on
01
0.0221
02
3.08e-05
03
1.13e-08
10:00Release stops
01
0.0575
02
6.16e-04
03
4.46e-06
15:00Five minutes after source off
01
0.0247
02
7.55e-04
03
1.07e-05
Height-averaged cells, identical linear colour scale in every frame. The film uses a separate log scale. Very low values can look black; that does not mean zero. The room means below include both height layers.
Volume-weighted room means from the same saved transient calculation. The log axis makes small downstream values visible; each line retains its absolute scale. The plotted range starts at 10⁻¹⁰ C*; zero at the clean start is omitted.
Clean-start, 10-minute release + 10-minute clearing phase. These views use the original solver fields before display compression. They are a spatial hypothesis, not CFD or measured odour. The visitor scores use a separate steady-start protocol.
05 / RETURN TO THE ORIGINAL QUESTION
Does separation still make choice meaningful?
The latest 4,680 m³/h exposure conditions were returned to the 30,000 resampled visits. This comparison keeps the release rate fixed and uses the same capacity and utility assumptions for all four options.
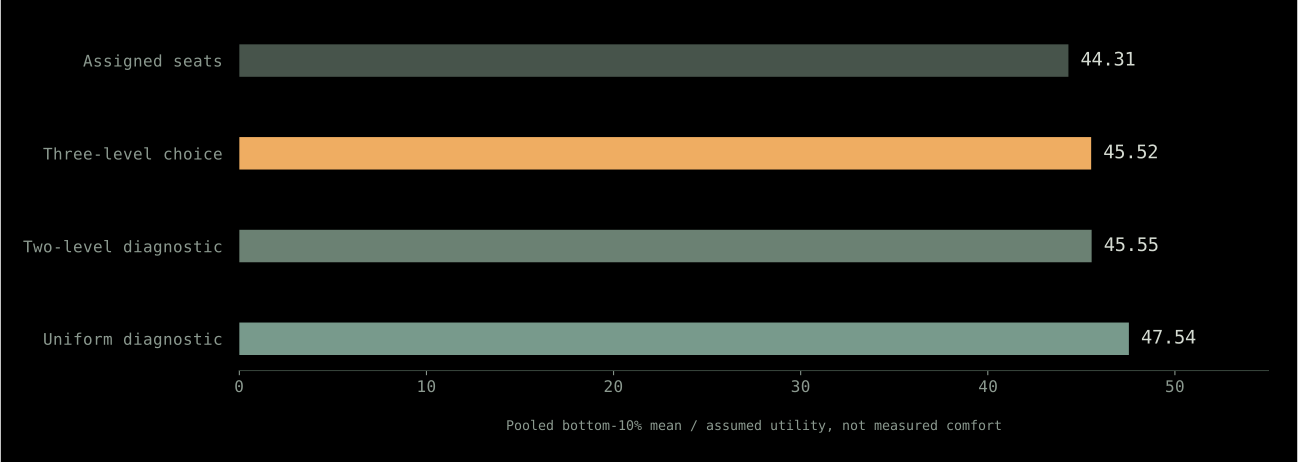
Latest same-release, instance-weighted scenario results. Two-level and uniform cases are mathematical diagnostics, not alternative built designs. Scores are assumed utility, not measured comfort.
+1.22
Choice versus assigned seats.
The pooled bottom-10% mean improves, but 95 of 300 session tails and 11.35% of individual visits are worse. There is no every-session or every-person guarantee.
−0.026
Three exposure levels versus two.
The third level adds no demonstrated scent-only benefit in the primary test. Uniform exposure also has a higher pooled lower-tail score. The third room’s programme, acoustic and social value requires its own evidence.
Sources, protocols and limitations
All spatial results are calculations from uncalibrated models. Public smell ratings support preference tests; they do not directly measure comfort in this architecture. Historical policy comparisons, later ventilation scenarios and the animated tracer pulse are separate experiments.
An out-of-fold residual model reduces average log error against the same-data interpolator by 13.9% in general conditions and 11.6% on P10. Both paired intervals favour ML. But Room 03 mean-error improvements are small and uncertain, and the general tail guard fails. The candidate is not adopted.
3,868IDENTICAL TRAINING LABELS
512 + 512SELECTION + INDEPENDENT GATE
2,048NEW FINAL-TEST CONDITIONS
All 3,356 previously opened v2/v3 cases become development data. Add 512 new training cases, including pressure transitions and P10. New selection and gate sets remain outside fitting. Final labels are generated only after the model, input split and evaluation code are frozen.
A STRONGER COMPARATOR
Let both methods adjust the axes.
Interpolation now has the same four axis-scale options as ML. The selected baseline is a cubic RBF over log concentration. Its improvement over v3 combines more data with a different representation; it is not credited to the learned correction.
LEARN ERRORS WITHOUT LEAKAGE
Hide each training point from its predictor.
Five folds keep all four contexts of an operating point together. A Matérn kernel learns the baseline’s out-of-fold errors. A correction weight of 0.25 is selected on validation, before the independent gate and final test.
All predictors see the same new inputs. Average absolute log₁₀(C* + 10⁻⁶) error, weighted equally across nine targets and eight wind/bypass regions. The grey v3 comparison uses less training data.
Room 03 is the unresolved test.
Mean absolute error is 1.0% lower generally and 0.3% lower on P10. Both paired confidence intervals cross zero. The five worst general operating points have 1.14× the baseline error, above the predeclared 1.10× guard.
Scaled interpolation itself reduces Room 03 MAE by 72.9% generally and 82.0% on P10 relative to the previous v3 baseline on these same new tests.
Linear C* errors for Room 03 means. C* is a normalised tracer quantity, not measured odour, ppm or comfort. Tiny differences are shown numerically rather than exaggerated by a truncated bar axis.4,000 paired bootstrap resamples, stratified by eight regions. Each base operating point retains all four contexts. Intervals are normalised by the observed baseline error; 256 base points per population. Below zero favours ML.
LAB 04 / CHECKPOINTS REPAIRED
The comparison keeps its exact input.
Selecting a stored condition preserves its original numbers and shows solver values plus both errors. Moving a slider or changing context explicitly clears the reference. Native slider rounding can no longer silently turn a checkpoint into custom input.
ACTUAL LOCAL FIT
Watch the residual model refit.
Fit one 967-case context in the browser while monitoring 128 independent gate cases. Only training residuals update the model. This is fixed-data computation, with no sensor feed or persistent learning.
Experiment 04 / exact results, selection and limits
Test
Interpolation log MAE
ML log MAE
Interpolation Room 03 MAE
ML Room 03 MAE
General / 1,024
0.000884
0.000761
4.829e-06
4.778e-06
P10 / 1,024
0.000549
0.000486
2.409e-06
2.402e-06
ML-minus-baseline paired 95% intervals: general log -1.559e-04 … -9.178e-05; P10 log -9.295e-05 … -3.728e-05. Room 03 mean MAE: general -3.764e-07 … +3.145e-07; P10 -1.037e-07 … +8.126e-08, in C*. General/P10 regional log improvements: 8/8 and 6/8; Room 03: 5/8 and 5/8.
The baseline search used 24 candidates: two RBF families × four shared axis scales × three target transforms. ML used 12 direct kernels and 60 residual/shrinkage configurations. Selection considered log error and linear Room 03 error; point-estimate guards filtered candidates before ranking. The separate gate already failed to establish Room 03 improvement. Its rejection is binding even if a final-test point estimate looks better.
Adoption requires upper 95% paired bounds below zero for both overall log MAE and Room 03 mean MAE in both populations; worst-five-basepoint Room 03 error ≤1.10×baseline; low-concentration Room 03 MAE ≤1.02×baseline; no target-family log MAE above 1.05×baseline; and numerical gates. General worst-five ratio 1.142; P10 0.996. Maximum and p95/p99 errors are retained in the result file. No model or rule was retuned after final labels were opened.
Baseline: cubic RBF, log₁₀(C*+10⁻⁶), lengths [0.5,4,4,2], absolute-centred-wind feature, zero smoothing. Residual: Matérn 5/2, lengths [2,4,4,2], ridge 10⁻⁶, raw signed residuals, alpha 0.25. All arms receive exactly 3,868 training labels. Old v3 holdouts are now opened development, never fresh evidence.
Inputs remain wind −6…6 Pa, supply 4,320…5,040 m³/h, lower general-extract share 25…75%, bypass 10…90 m³/h, two temperature profiles and two door events. P10 is the ventilation plan, not a lower 10% visitor score. New base points are separated by ≥0.06 grid-cell widths from old v2/v3 and other new points; this deliberately spaced in-domain test does not establish unseen-family or field performance. The spacing was fixed before labels and differs from v3’s 0.10.
The unchanged 20-minute solver starts at closed-door steady state with a continuous lower Room 01 source. Film release/clearing is a different protocol. No visitor preferences or physical comfort were retrained.
Experiment 03 improved the old grid but did not establish ML superiority on P10. Its final labels are now development evidence for Experiment 04; these historical scores use a different test.
Every method sees the same fresh test inputs. Average absolute log₁₀(C* + 10⁻⁶) error, with equal weights for nine targets and eight regions. Improvement over the old grid includes the effect of more data.Room 03 mean only. Other lower-layer means and door-change-sampled maxima are evaluated in the full evidence. The 0.001 C* floor used for percentage errors prevents near-zero denominators; C* is not a measured odour unit.Full experiment 03 / original protocol and results
06 / MACHINE LEARNING · EXPERIMENT 03
A closer fit to three rooms. A tougher test for ML.
The new kernel model reduces error against the original grid by 92.4% in general conditions and 92.9% on P10. A stronger comparison asks whether it beats interpolation using the same training labels. That result is mixed. The old-grid comparison changes data coverage and approximation method together.
1,792NEW DIRECT-SOLVER RUNS
1,948SHARED TRAINING LABELS
896FRESH FINAL-TEST CASES
1,564 opened v2 cases + 384 new fit cases form development. Another 512 new cases select models; 896 final cases are generated only after the selected model and evaluation code are frozen. No validation refit or test-driven retuning.
WHAT CHANGED
Use smooth kernel regression.
A regularised Matérn 5/2 kernel uses the four controls plus absolute centred wind. This accommodates the change around wind reversal without a discontinuous split. It learns raw C* targets, avoiding excess emphasis on tiny values. Geometry, source and target definitions stay fixed.
A FAIRER COMPARISON
Give interpolation the same data.
The competing cubic radial-basis interpolator uses all 1,948 labels and the same wind representation. The old grid uses only its 540 anchors. Both new methods are selected on balanced validation across all eight wind/bypass regions, including P10.
Both new methods improve Room 03.
Kernel Room 03 mean MAE falls from 2.26e-04 to 1.91e-05 C* in the general test, and from 1.45e-04 to 1.18e-05 C* on P10. Its 95th-percentile scaled error is 1.99% and 1.08%, respectively.
Against the full-data interpolator, the kernel’s general log-error gain is 13.2% with a paired interval below zero. On P10 the point-estimate gain is only 2.0% and its interval includes zero. P10 Room 03 mean MAE is 3.5% worse, and its worst error also fails the guard.
THE DEFAULT
Keep the stronger baseline available.
Full-data interpolation was selected before the final test: the kernel had narrowly missed the validation worst-Room03 guard. Final results retain that choice. The default reduces Room 03 MAE against the old grid by 91.5% generally and 92.2% on P10.
LIVE MODEL LAB 03
Three predictors. One input.
Switch between the original grid, the full-data interpolator and the kernel. Compare exact saved solver checkpoints, or fit one 487-case context in your browser while monitoring 128 validation cases.
Selected kernel: Matérn 5/2, scaled length parameters [1,2,2,1], regularisation 0.0001, raw targets. Comparator: global cubic RBF, zero smoothing, raw targets, linear polynomial term. Both share the absolute-wind input feature and identical labels. Kernel regression and interpolation are closely related function approximators; this does not demonstrate discovery of physics.
Kernel-minus-full-interpolation log-error 95% paired intervals: -0.000285…-0.000062 generally; -0.000122…0.000078 on P10. The kernel improves 6/8 general regions and 3/8 P10 regions. Bootstrap resamples base operating points, keeping all four contexts together, within each of eight regions.
Co-primary adoption requires both intervals below zero, improvement over the old grid, better Room03 mean MAE and p95 error, no increased low-tail MAE, worst Room03 error ≤ 1.10× the full-data baseline, no target-family log-error increase above 5%, and numerical screening gates. General final-test checks pass; P10 fails three checks. Validation had already selected the full-data baseline. No model was retuned after opening final tests.
Inputs remain bounded: wind −6…6 Pa; supply 4,320…5,040 m³/h; lower general-extract share 25…75%; bypass 10…90 m³/h. Two temperature profiles × two door events. New points stay at least 0.10 grid-cell units from all earlier points in L∞ distance; this deliberately spaced in-domain test is not extrapolation or unseen-family validation.
Each 20-minute run begins at closed-door steady state with one continuous lower Room01 source. The film uses a separate 10-minute release plus 10-minute clearing protocol. Nine source-column0 targets; peak units are corrected in the derived adapter. P10 means the ventilation plan, not the visitor-score lower10%. No visitor preferences were retrained.
The Lab is self-contained and verifies the same SHA256 checksum with Web Crypto or a JavaScript fallback. It needs no server for inference or fitting. These are local computations over fixed data; no sensors or live external data are connected.
Earlier results stay visible, including failed acceptance tests. Each chart belongs to its own held-out experiment; scores across experiments use different tests.
EXPERIMENT 02 / RESIDUAL NOT ADOPTED
A close-looking fit can still lose to interpolation.
The learned correction increased average log error on the fresh tests. The general-test uncertainty interval includes zero; deterioration on P10 is clearer. This led to the stronger same-data comparison in Experiment 03.
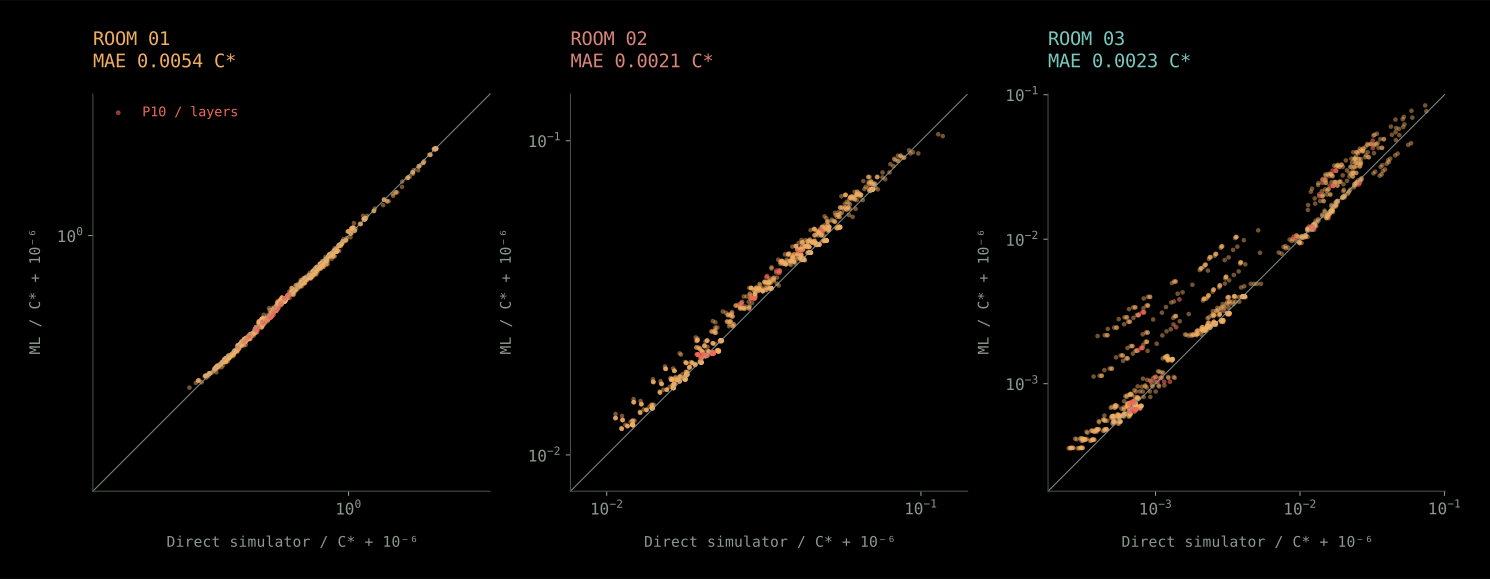
Room 03 means. Points on the diagonal match. The relative-error denominator is floored at 0.001 C*; these percentages are not odour or comfort accuracy.Full experiment 02 / protocol, metrics and limitations
06 / MACHINE LEARNING · EXPERIMENT 02
More data helped. The residual did not generalise.
Front-normal wind, Room 03 transfer and the P10 extraction split now have a dedicated data grid. A small model learned the error left by interpolation. It reduced selection-validation error by 53%. On new tests it was worse overall, with mixed results between general-test regions and clearer deterioration on the P10 plane.
1,558NEW DIRECT-SOLVER RUNS
512RESIDUAL FIT CASES
320FRESH FINAL-TEST CASES
1,564 distinct conditions = 540 anchors (6 reused exact earlier runs) + 512 residual-fit + 192 validation + 256 general test + 64 P10-plane test. Each test is outside fitting and tuning. These are simulated conditions, not measured visitors.
THE DATA
Surround the difficult conditions.
Front wind −6…6 Pa, supply 4,320…5,040 m³/h, lower general-extract share 25…75%, interzone bypass 10…90 m³/h. Fixed vestibules, two-layer rooms and 360 m³/h local extraction. Two door events and two temperature profiles are enumerated. Each 20-minute run starts at the closed-door steady state with a continuous source; this differs from the film’s release-and-clearing sequence.
THE MODEL
Learn what the grid misses.
A fixed 540-point grid predicts by multilinear interpolation. A 336-feature ridge model fits log-concentration residuals on separate interior cases. Validation selects the basis, regularisation and correction strength. The same anchor grid is used throughout.
Every model is compared on the same new conditions. Lower is better. The model and evaluation code were frozen before final-test targets were generated. No final-test retuning.
Keep interpolation as the default.
The residual raises mean log error by 8.7% on the general test and 61.1% on the P10 plane. Room 03’s 95th-percentile scaled error rises from 22.9% to 36.2% overall, and from 18.8% to 43.3% on P10. Its worst absolute error also grows in both tests. The general-test uncertainty interval includes zero; the P10 interval is entirely above zero.
A useful local gain remains: general-test Room 01 mean MAE falls from 0.00516 to 0.00152 C*. It does not justify accepting the model for all rooms. The fixed-grid baseline passes the declared numerical screening tolerances in both tests. This is in-domain agreement with an uncalibrated simulator, not physical validation; the direct simulator remains the design reference.
SEPARATE THE TWO EFFECTS
Coverage improved. The correction did not.
Holding the IDW5 algorithm and feature scaling fixed, adding the new anchor/fit data reduces log error by 70.8% overall and 70.8% on P10. This isolates data addition for IDW5 with its old feature scaling. It does not establish an optimal interpolator. The residual comparison keeps its 540-anchor base fixed but adds 512 training labels; a local interpolator using all 1,052 new labels remains untested.
LIVE MODEL LAB
A different job from the film.
Change the four controls and calculate a new prediction in the browser. Compare saved direct-solver checkpoints. Run an actual fresh residual fit from zero and watch validation error change.
Mean absolute log₁₀(C* + 10⁻⁶) error, equally weighted over nine targets and the two held test regions. Direct ML is trained on the same 1,052 new-grid anchor/fit labels. Frozen v1 models and both IDW variants are evaluated on these exact same fresh cases; their older test scores are not the improvement denominator.
Test interiors are withheld by wind-band × bypass-band, across all supply/extract cells and four contexts. Anchor corners still bound those test cells: this is an in-domain combination test, not unseen-family or extrapolation evidence. Minimum scaled distance to all old and new development inputs is 0.0903, exceeding the predeclared 0.01 exclusion margin.
Paired bootstrap: residual-minus-base log error 95% interval -0.00048…0.00309 overall; 0.00425…0.00982 on P10. Base operating points are resampled with all four contexts together, within two fixed test regions. These intervals do not describe all environmental uncertainty. Validation uses central wind bands while tests use outer bands. In the general test, the negative-wind/low-bypass region improves (0.01149 → 0.00855), while the positive-wind/high-bypass region worsens (0.01859 → 0.02415). The pooled general-test increase is not statistically resolved by this interval; P10 deteriorates in both regions.
Nine targets: three lower-layer means, three room means and three door-change-sampled maxima, all from Room 01 source column 0. No preferences, comfort scores or spatial velocity field are learned. P10 here names the ventilation design, not the bottom-ten-percent visitor score. The 30,000-visitor model has not been retrained in this experiment.
Predeclared gates: per-target mean MAE ≤ 0.02 C*, sampled-maximum MAE ≤ 0.05 C*, log MAE ≤ 0.10, p95 scaled error ≤ 25%; residual must improve each test with a negative paired-bootstrap upper bound and no increased worst Room 03 error. These are research tolerances, not safety standards. The candidate fails acceptance on both tests.
The first model exposed Room 03 and front-wind errors.
5,720 run records supported the first benchmark. A small overall gain did not protect the hardest wind family or the Room 03 error tail.
Every point is one distinct held-out calculation. The diagonal is exact agreement. Axes use C* + 10⁻⁶ on a log scale; C* is a reference-normalised tracer quantity, not a measured odour unit. Charts show room means; lower-layer proxies and sampled maxima are also scored.Full experiment 01 / protocol, metrics and supply test
06 / MACHINE LEARNING · EXPERIMENT 01
A model, tested beyond its training conditions.
TRAINED + HELD-OUT TESTED · PROTOTYPE · SCREENING GATES NOT MET
Can a small ML model reproduce the multi-zone simulator? Gradient-boosted trees were trained on existing runs and compared with simpler predictors. The tests use conditions that were withheld from fitting and tuning.
5,720SIMULATION RECORDS
3,358UNIQUE EFFECTIVE INPUTS
2SEPARATE HOLDOUT TESTS
2,362 repeated representations were collapsed. Physically equivalent conditions stay together. This model learns a fixed-geometry, 20-minute compartment calculation with one Room 01 source; it does not learn human comfort or the animated spatial field.
Showing held-out environment conditions.
The environment-test scatter plot is shown directly above this record.
2,398 FIT / 960 TEST
12 complete conditions withheld.
The test covers closed-door exchange, vestibule size, front-normal wind and combined wind stress. All plans, door events and mixing structures for these conditions were kept out. The 960 distinct test inputs represent 1,320 original records.
EXTRAPOLATION / INCLUDING UNLEARNED EFFECTS
Some inputs never varied during training.
Every test input extends at least one training range. Closed-door exchange and vestibule volume were constant in development, covering 320 of the 960 test cases. Good scores there reflect weak simulator sensitivity; they do not demonstrate a learned response to those variables.
Model
Grouped log error ↓
Front-normal wind error ↓
Gradient boosting / ML
0.0435
0.0933
Nearest neighbour
0.0451
0.0781
Distance-weighted neighbours (k=5)
0.0780
0.0694
Ridge regression
0.1030
0.0789
Grouped log₁₀ error averages all nine targets with equal weight per condition group. MAE is mean absolute error. Hyperparameters were chosen with three grouped folds inside the development data.
The worst wind family defeats the ML model.
Across the full test, Room 01’s median scaled error is 0.53%, while Room 03 reaches 199.1% at the 95th percentile. These pooled scores include the two constant-in-training inputs described above.
The small overall gain hides a worse result on front-normal wind: ML log error is 0.0933, against 0.0781 for nearest neighbour. Every baseline in the table does better on this family. The Room 03 log-error and tail-error gates also fail.
Scaled error = |prediction − reference| / max(reference, 0.001 C*). The floor prevents tiny concentrations from producing unbounded percentages. The full error distribution and worst cases remain in the evidence.
2,516 FIT / 842 TEST
All nominal 4,680 m³/h plans withheld.
P4, P6 and the current P10 were excluded together. Their 1,560 original records reduce to 842 distinct inputs. Environment families are shared across this split, so this is a separate supply/design test.
CURRENT DESIGN / P10
The unbracketed extract split matters.
All inputs sit within marginal training ranges, but this does not guarantee coverage of their combinations. P10’s layered cases have no matching linear interpolation bracket.
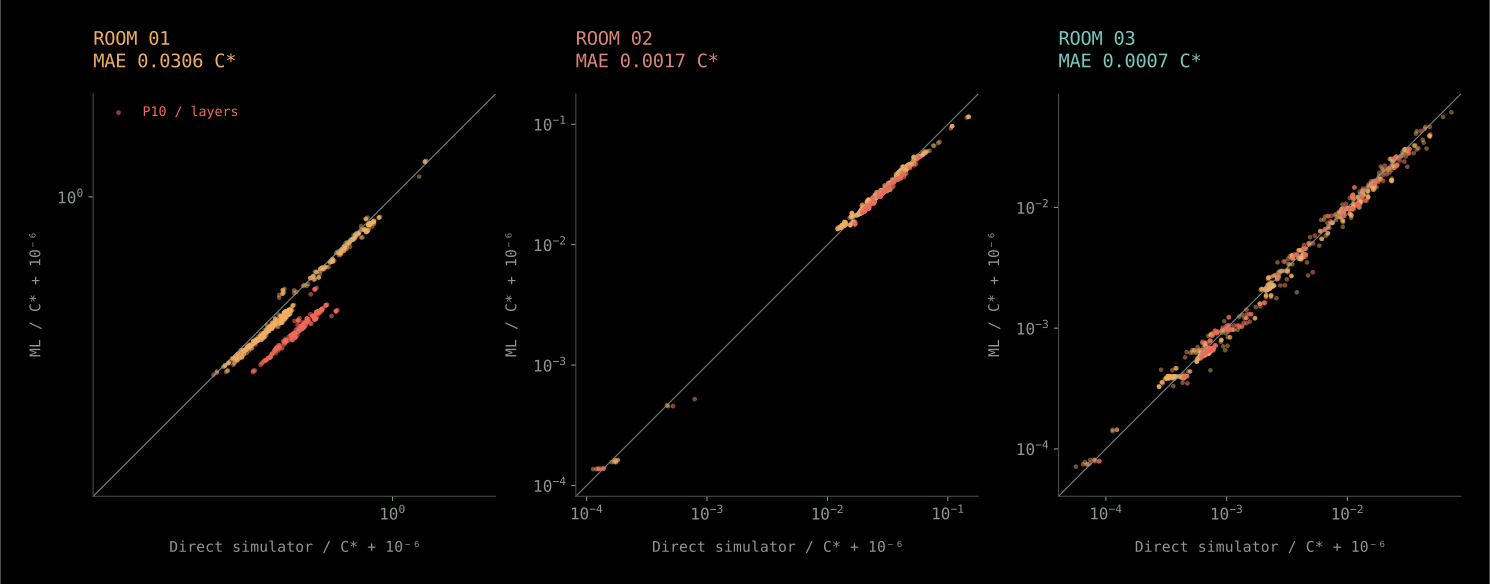
Gold: other held-out inputs. Red: P10 with two room layers. P10 layered Room 01 MAE is 0.0786 C*, with 10.2% median scaled error. The same 0.001 C* denominator floor applies.
Model
Grouped log error ↓
Room 01 MAE / C*
Gradient boosting / ML
0.0291
0.0306
Nearest neighbour
0.0494
0.0528
Distance-weighted neighbours (k=5)
0.0481
0.0248
Ridge regression
0.0961
0.0167
Grouped log₁₀ error averages all nine targets with equal weight per condition group. MAE is mean absolute error. Hyperparameters were chosen with three grouped folds inside the development data.
Simple interpolation wins where it is available.
Exact bracketing runs exist for 629 of 842 test inputs. On that same subset, Room 01 MAE is 0.0029 C* for linear interpolation versus 0.0143 C* for ML. Unbracketed cases receive no interpolation prediction.
The ML model fails the predeclared source-room mean-error gate in this test. Lower average log error does not make it a reliable replacement.
DATA AUDIT
Correct the labels before learning.
The stored maximum field was labelled C* but contained unnormalised values. The derived training table corrects the scale; the original runs are preserved. Maxima are sampled at door-change times and can miss an interior transient.
WHAT HAS BEEN PROVED
A reproducible simulator benchmark.
Splits, transformations and error gates were frozen before fitting. The trained models, predictions and verification files are saved. Neither test meets all screening gates; the direct simulator remains the design reference.
Model scope, thresholds and reproducibility
Nine targets: three room means, three lower-layer means (uniform room proxies for the mixed structure), and three door-change-sampled room maxima. All use source column 0. Models learn log₁₀(C* + 10⁻⁶); event and mixing structure match exactly in the neighbour baselines. For mixed rows the lower-layer proxy duplicates the room mean, so that mean receives double weight in the joint score. No observed human data or new field measurements were added.
The pre-fit prototype gates require per-target mean MAE ≤ 0.02 C*, sampled-maximum MAE ≤ 0.05 C*, log₁₀ MAE ≤ 0.10, 95th-percentile scaled error ≤ 25%, and room-order agreement ≥ 95%. These are research screening tolerances, not building or safety standards. Both experiments tune using condition-grouped inner folds; those folds do not mimic the separate supply holdout.
On 12 matched test cases, median direct cold-call time was 46.5 ms per case; preloaded ML feature construction and batched inference took 0.32 ms per case. This excludes model fitting and loading and does not compare warm solver caches.
Geometry tests expose the compromise between lower modelled exposure, a short withdrawal and seeing the shared task and all three peers.
57,312 DIGITAL SCENARIOS / NO FULL COMBINED CANDIDATE / NO NEW ML
This earlier study is retained below. The final C1/F1b evidence map and N1 visibility result are linked above. Human satisfaction and sign recognition remain outside the model.