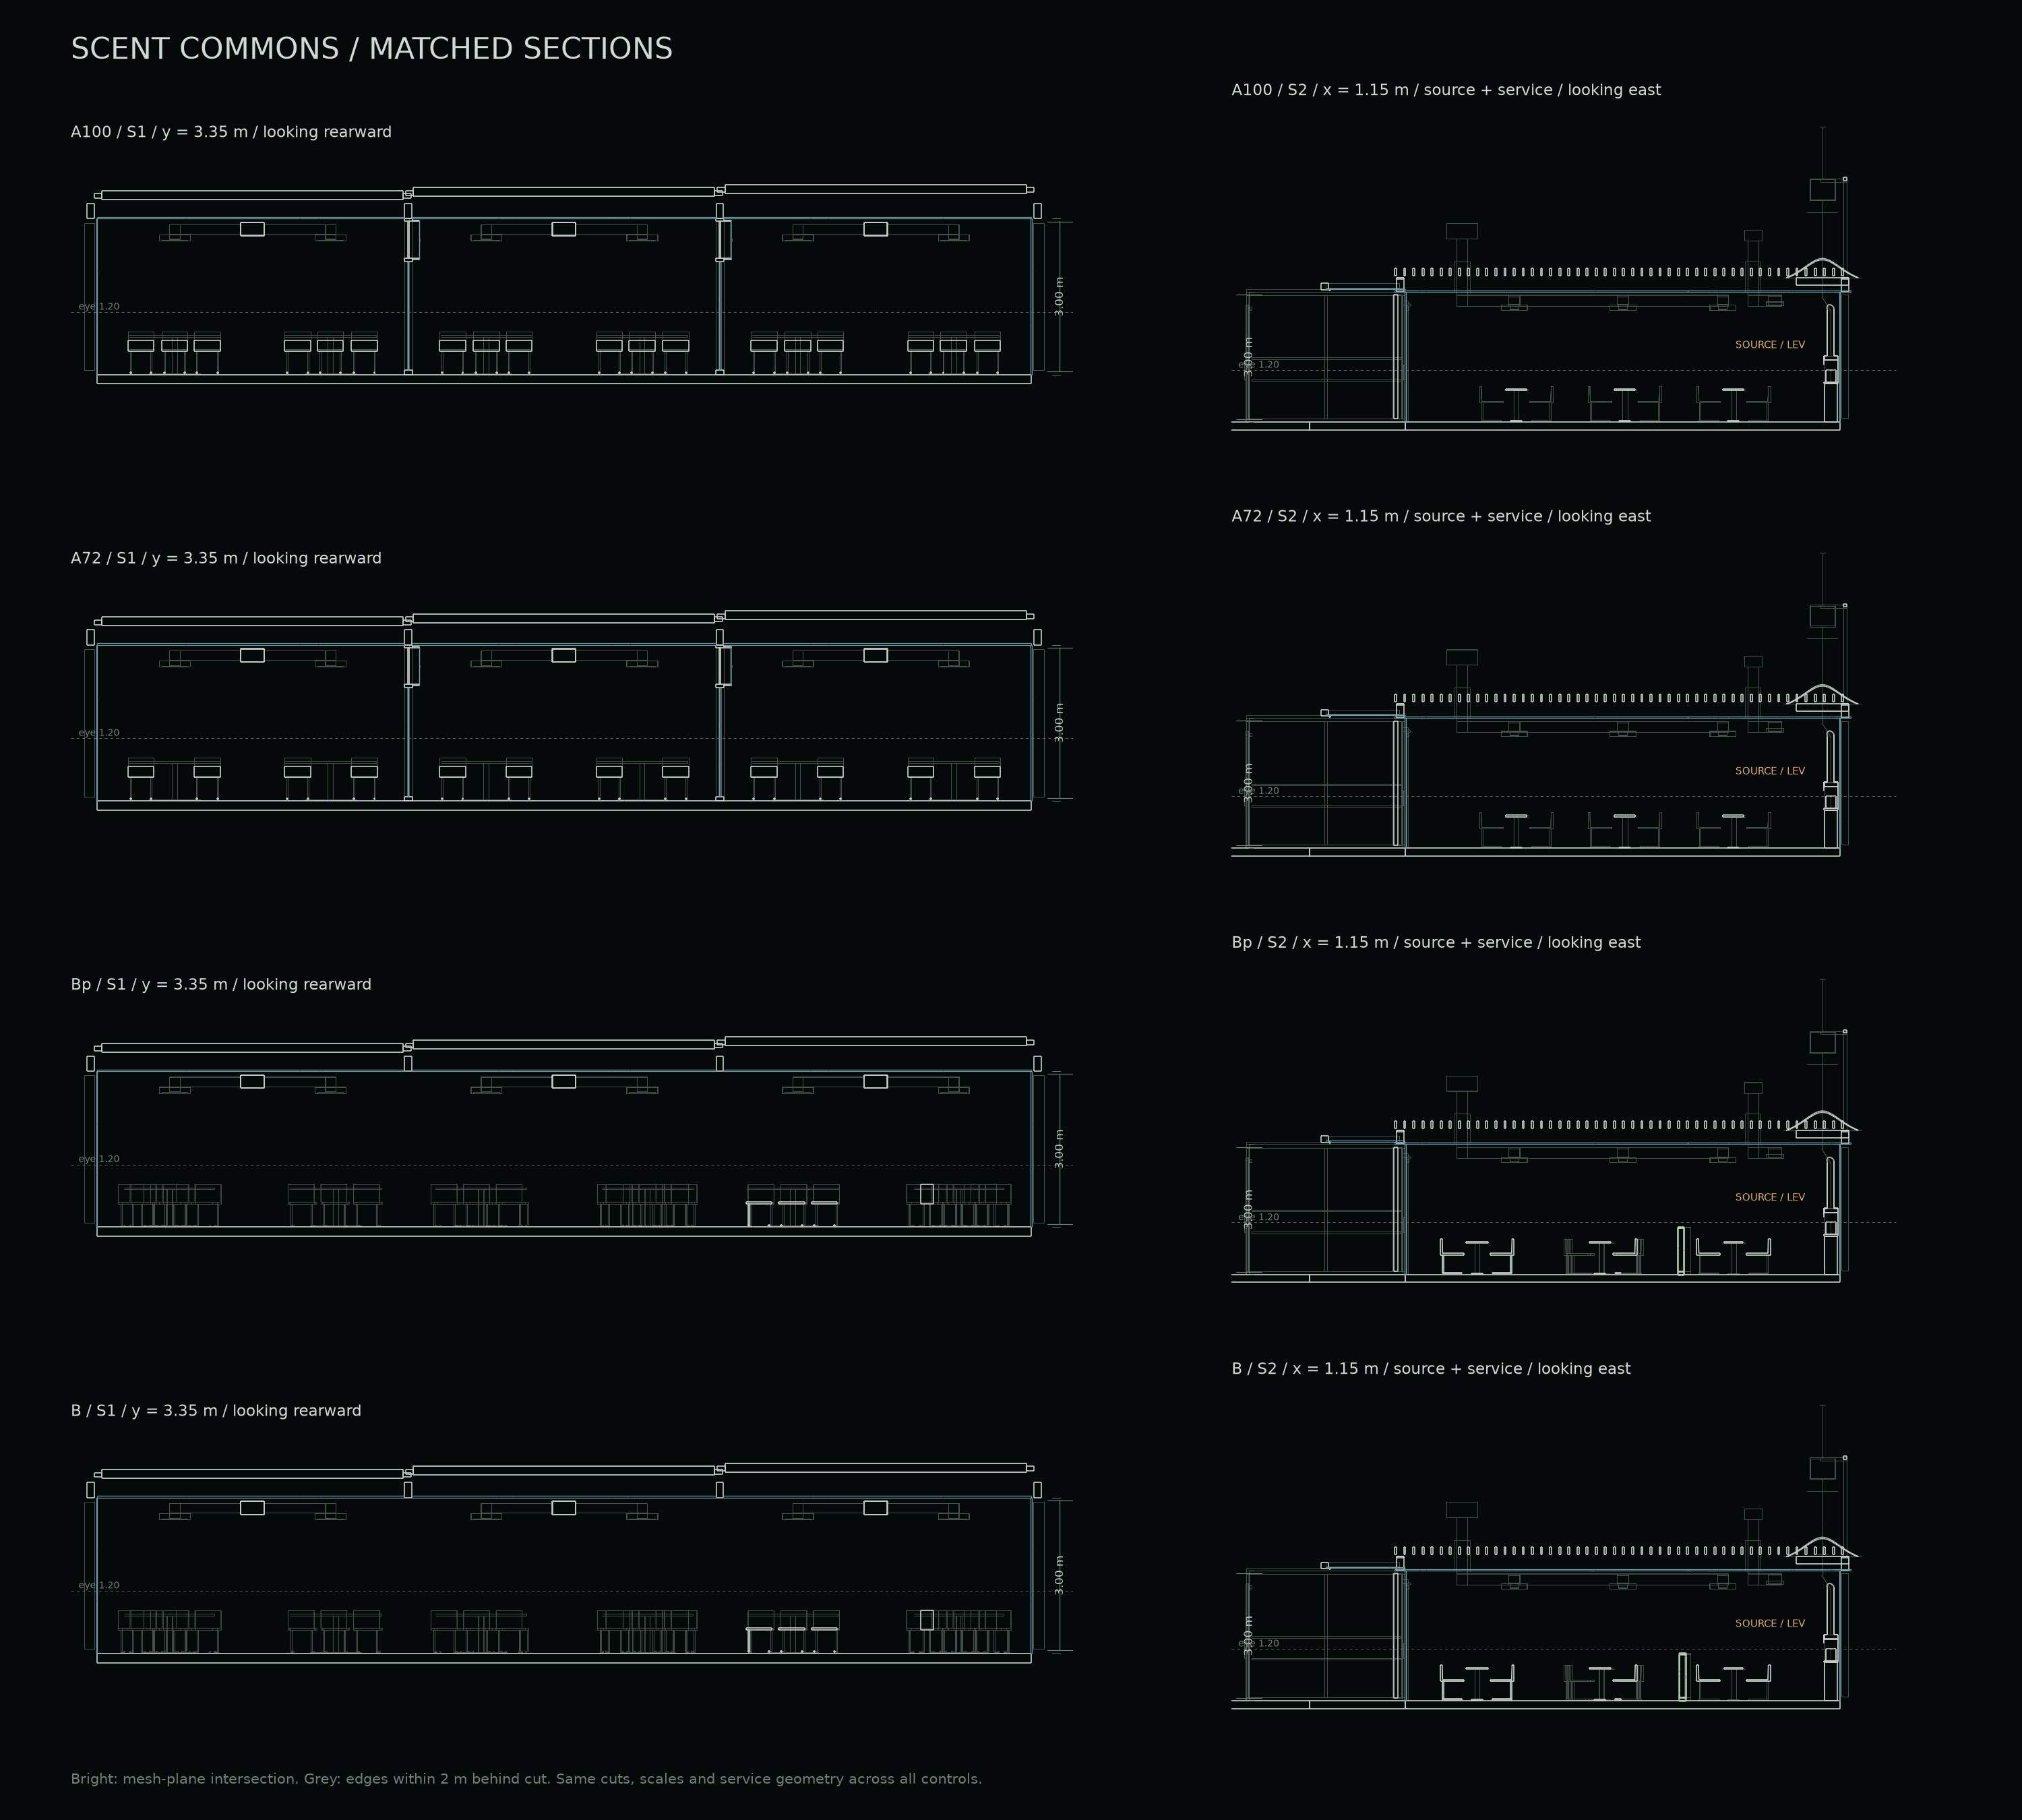
Colour makes the system legible
The Centre Pompidou’s blue air-service code informs the colour choice, not a copied building geometry.
SCENT COMMONS / RESEARCH RECORD
The route comparison shows which virtual users gained a suitable seat. A later check tested whether the same users still qualified after the simulated walks were saved and reopened.
C1 + F1b / OVERALL CONCLUSION V115
The fixed design retains C1's 21 central-route gains and F1b's 3 gains throughout the fixed-150-mm panel plus 2 conditional gains. N1 visibility is separate: 451/574 main passes, including 369 frame-804 passes. Tracking moving exposure adds a third result: shorter travel does not guarantee lower cumulative or peak exposure.
Airflow, turn/posture timing and saved-time placement affect the comparison. V112–V114 add a practical limit: the largest tested shortcut preserving the old visibility-pass sets saves 11.8 mm and adds no qualifying profile. Retain the final route. Remaining unmet profiles, visibility failures and the Dlow archive mismatch are kept explicit.
Read the integrated evidence map · Open the English A3 conclusion
V118 ADDENDUM / ORIGINAL THREE-ROOM VENTILATION MODEL
V116 and V117 used frozen concentration predictors to select extraction and supply settings, then checked their choices in the original simulator. Useful modelled settings were found; ML and interpolation made identical choices. The earlier failed adoption gate is unchanged. This is separate from the final two 72-seat rooms, their virtual profiles, N1 visibility and moving-exposure comparisons.
RETURN SIGHTLINES / N1 TABLETOP MARK
We paired 41 N1 chair positions with 14 seated S1 postures, giving 574 configurations. Each was tested over eight virtual round trips across the two rooms, two occupancy conditions and two body types. The mark stayed 556 mm forward of the F1b seated position.
At 30.0 mm right, 451 of 574 configurations passed all eight trips. On each higher-torso trip, at least 18 of 35 points were visible throughout frames 57–83. On each broader-body trip, that threshold held for at least 306 frames. Of those 451 configurations, 369 also met the threshold at frame 804 on all four broader-body trips.
At the experimental boundary of approximately 29.02 mm right, the nominal test points and the points sampled from the Rhino face first matched the selected design on the tested grid. The same configurations passed. For each of the 45 tracked cases, the shortest stretch of continuous visibility before the turn, taken across its four broader-body trips, was also the same.
Across those 180 trips, the minimum distance from point 18 to the camera’s right field-of-view plane at the last frame before the turn increased from +1.651 mm at the boundary to +2.482 mm at the selected position. The gain was 0.832 mm using the unrounded values. A positive value places the point inside the camera view.
C1 → N3 / REOPENED SIMULATION FILES
The normal C1–N3 save now records metre coordinates to eight places, from the live body before its pelvis centre is measured. We wrote fresh complete walks for both 72-seat layouts and read them back in a separate process. The 30 mm lead-in remains the design.
Both rooms used the same 7,490 virtual profiles. Every row covers all outward and return offsets from −9 to +9 mm. We checked the identities of everyone who qualified, including all 14 earlier and seven later gains from the shorter route. The last two columns show the smallest remaining budget among those 21 users, using the same centred walk as the reference for each reading. There are 1,000 micrometres in a millimetre.
| Lead-in | Pairs keeping all 21 after reopening | Users whose result changed | Tightest reserve · live | Tightest reserve · reopened |
|---|---|---|---|---|
| 19 mm | 361/361 | 0 | 19 µm | 13 µm |
| 20 mm | 361/361 | 0 | 221 µm | 216 µm |
| 21 mm | 361/361 | 0 | 408 µm | 403 µm |
| 22 mm | 361/361 | 0 | 581 µm | 576 µm |
| 30 mm | 361/361 | 0 | 1,583 µm | 1,578 µm |
The four shorter lead-ins give 1,444 length-and-offset combinations per room. No profile gained or lost eligibility against the unrounded motion, and every user who qualified before the shortcut retained a seat. At 30 mm the tightest saved budget still had 1.58 mm left. The independent F1b control retained its earlier 73 unmet profiles.
Each file includes the ordered positions of the whole body and both chairs, from leaving C1 through sitting at N3 to the final return. We checked two chair strokes at C1 and four at N3 in the reopened frames. The final body pose and both chair positions matched their saved start, including the tightest 19 mm trip.
Each layout was simulated separately. We reopened 386 complete private motion files. To cover every pair, we combined a saved outward leg with a saved return leg only where their complete seated body and chair states matched exactly at N3. The two body shapes used by the virtual cohort covered the whole grid. The 22 additional direct trips included mixed directions, marked starts, lighter occupancy and a third body shape used as a control. The full grid used the more occupied scene in each room, which includes the obstacles in the lighter setting.
The reader checked the file checksum, format, units, eight-place precision and route identity before summing the distance between successive stored pelvis centres. For two complete files we also compared every stored body coordinate with the live coordinate rounded to eight places. All 6,881,280 values agreed. The primary comparison used the same centred-walk reference as the earlier study. As a separate check, we used each user’s fixed distance limit directly, without subtracting the centred walk. That different reference changes the amount of reserve. At 19 mm it left 70 µm live and 65 µm after reopening. Both methods kept the same users. Airflow readings, starting preparation, preferences and individual distance limits stayed fixed.
Earlier six-place files remain readable as historical records. The current replay rejects a six-place file, an incorrect route or a damaged file. The figures above measure simulated walking distance and the return of the saved poses.
STUDY HISTORY
One study asked whether changing the air supply could give a nearby seat lower exposure. We then checked whether a person at a different starting table could move away, keep the group in sight and return. The first placement test located the usable band. A second test compared the 100 and 103 mm marks for the group chair. We then held that chair at 103 mm and shifted the destination chair. The back-left position came closest to the exposure limit, so we tested the airflow estimate on finer grids.
Air supply and the nearby seat · Chair plan and return path · Placement tolerances · Paired mark comparison · Destination chair positions · Finer airflow grids · Outlet working settings · Single-donor transfer limits · Two donors feeding one outlet · How the 18 + 6 split responded to flow errors · Two smaller changes at 2 seconds · The complete half-second comparison · Foot placement and remaining seat needs · The half-metre C1-N3 route · The one-metre route · The first sideways walking tests · The eight-millimetre limit · The 20 mm entrance · The 30 mm walking reserve · The effect of coordinate rounding · Seven and eight decimal places
The records below run from the most recent seating changes back to the first movement studies.
C1 → N3 / SAVED COORDINATES
The study follows 21 virtual users who gained a suitable seat when the C1–N3 walk was shortened. From 19 to 22 mm, all 21 kept that seat on every tested trip before rounding and at eight decimal places. We also checked the complete group of 7,490 virtual profiles. No one changed eligibility at eight places. Seven places changed one user’s result on one pair, at 19 mm. The same user changed in B′72 and B72.
Each row counts the 361 ways to combine outward and return offsets from −9 to +9 mm. A passing pair keeps all 21 within their individual distance budgets. The 18 mm row checks the lower edge, and 30 mm is the retained design.
| Lead-in | Before saving | Six places | Seven places | Eight places |
|---|---|---|---|---|
| 18 mm | 360/361 | 360/361 | 360/361 | 360/361 |
| 19 mm | 361/361 | 360/361 | 360/361 | 361/361 |
| 20 mm | 361/361 | 360/361 | 361/361 | 361/361 |
| 21 mm | 361/361 | 360/361 | 361/361 | 361/361 |
| 22 mm | 361/361 | 361/361 | 361/361 | 361/361 |
| 30 mm | 361/361 | 361/361 | 361/361 | 361/361 |
At 19 mm the unrounded cutoff was tightest going left 9 mm and returning right 9 mm. On this trip seven places retained all 14 early gains and six of the seven later gains. At 20, 21 and 22 mm, both precisions gave the same decisions as before saving. Everyone who qualified before the shortcut still qualified at every tested setting.
These are the smallest reserves among the 21 users, in micrometres (1,000 µm = 1 mm). A minus sign means the recorded distance exceeded the user’s limit. The sign comes from the full distance sum before display rounding.
| Lead-in | Before saving | Six places | Seven places | Eight places |
|---|---|---|---|---|
| 18 mm | −202 µm | −661 µm | −251 µm | −207 µm |
| 19 mm | +19 µm | −503 µm | −27 µm | +13 µm |
| 20 mm | +221 µm | −307 µm | +170 µm | +216 µm |
| 21 mm | +408 µm | −97 µm | +360 µm | +403 µm |
| 22 mm | +581 µm | +85 µm | +535 µm | +576 µm |
| 30 mm | +1583 µm | +1053 µm | +1532 µm | +1578 µm |
Coordinates are expressed in metres. Seven decimal places put consecutive stored values 0.1 µm apart. At eight places the spacing is 0.01 µm. Small differences accumulate across thousands of frames. On the 19–22 mm grid the largest change in centre-referenced round-trip distance was 54.4 µm at seven places and 5.6 µm at eight. At 30 mm, the tightest user retained 1.58 mm before rounding, 1.53 mm at seven places and 1.58 mm at eight places.
The table counts pairs where any profile in the full cohort changed eligibility compared with the unrounded score. The four lead-ins give 1,444 length-and-offset combinations per room. We matched identities separately in the two rooms. Both produced the same counts. All changed decisions at seven places belong to the single user described above. Nobody else gained or lost a seat. The unchanged F1b comparison still had 73 profiles without a suitable seat.
| Lead-in | Seven places · changed pairs | Eight places · changed pairs |
|---|---|---|
| 19 mm | 1 | 0 |
| 20 mm | 0 | 0 |
| 21 mm | 0 | 0 |
| 22 mm | 0 | 0 |
Each reading used the same 512 intervals for the sideways approach and another 512 for the fade. We rounded vertex coordinates before calculating the pelvis centre in each frame, reloaded the stored values, then added the distances between successive centres. Each reading used its own centred trip as the reference. Profile preferences, starting preparation, distance limits, both room layouts and both occupancy settings stayed fixed.
The six-place control reproduced the earlier saved decisions. A 15-place control reproduced the unrounded decisions. We checked 50 complete motion replays, including 8 marked starts, against the directional distance calculation. The seated handoff and the return of the body and both chairs were verified. In nine additional replays we saved and reopened the complete three-dimensional body and chair states at the start, at N3 and back at C1. The simulations retained both chair strokes at the starting seat and all four at N3.
Agreement here means the same profiles qualified on the tested grid. The distances measured from eight-place coordinates still differ slightly from the unrounded distances. The test measures simulated walking budgets and chair restoration.
Previous study · why six places moved the cutoff from 19 to 22 mm →
C1 → N3 / THE SAME WALK, MEASURED TWICE
We tested every whole-millimetre lead-in from 18 to 30 mm. At 18 mm, both readings put one user over budget. At 19 mm, all 21 who gained a seat on the shortcut passed every offset pair before rounding, with 0.02 mm to spare on the tightest trip. The saved reading first retained everyone on every pair at 22 mm, with 0.08 mm left. The cutoffs identify the first passing marks on this 1 mm grid. Intermediate lead-in lengths were not sampled. The 30 mm design retains 1.58 mm and 1.05 mm respectively.
At 21 mm the difference came down to one of the seven most recent seat gains. Going 9 mm to the walker’s left and returning 9 mm to their right, this person had 0.41 mm left before rounding and exceeded the saved-frame limit by 0.10 mm. The other 360 pairs kept all 21 either way. At 22 mm the same trip had 0.58 mm left before saving and 0.08 mm after. All original passes held and both chairs returned home, including on the over-budget trip.
Each row covers the same 19 outward offsets and 19 return offsets, from −9 to +9 mm. Negative reserve means a walker exceeded their personal distance limit. The table shows the smallest remaining distance among the same 21 users. Seat decisions used the full numerical sum before the table was rounded for display.
| Lead-in | Pairs keeping all 21 · before saving | Pairs keeping all 21 · saved | Tightest reserve · before saving | Tightest reserve · saved |
|---|---|---|---|---|
| 18 mm | 360/361 | 360/361 | -0.20 mm | -0.66 mm |
| 19 mm | 361/361 | 360/361 | 0.02 mm | -0.50 mm |
| 20 mm | 361/361 | 360/361 | 0.22 mm | -0.31 mm |
| 21 mm | 361/361 | 360/361 | 0.41 mm | -0.10 mm |
| 22 mm | 361/361 | 361/361 | 0.58 mm | 0.08 mm |
| 23 mm | 361/361 | 361/361 | 0.74 mm | 0.26 mm |
| 24 mm | 361/361 | 361/361 | 0.89 mm | 0.36 mm |
| 25 mm | 361/361 | 361/361 | 1.03 mm | 0.52 mm |
| 26 mm | 361/361 | 361/361 | 1.15 mm | 0.65 mm |
| 27 mm | 361/361 | 361/361 | 1.27 mm | 0.79 mm |
| 28 mm | 361/361 | 361/361 | 1.38 mm | 0.89 mm |
| 29 mm | 361/361 | 361/361 | 1.49 mm | 0.99 mm |
| 30 mm | 361/361 | 361/361 | 1.58 mm | 1.05 mm |
Across all 7,490 virtual profiles at C1, one additional person outside the tracked 21 qualified before rounding on two pairs at both 21 and 22 mm. Counting each person once per length, two users changed eligibility at 21 mm across three pairs, and one at 22 mm across two pairs. The same people changed in both rooms. Nobody who qualified from the saved coordinates lost eligibility when scored before rounding. The F1b comparison retained its earlier 73 unmet profiles.
B′72 and B72 used identical virtual users, starts, distance limits, furniture and seat choices. Each curve was sampled at 512 intervals on the approach and again on the fade. Both readings followed the same posed body along the same route. In one, we measured each pelvis centre before saving. In the other, each body vertex was rounded to the nearest micrometre before the centre and the total distance were calculated. Both readings used the same starting preparation and charged the extra walking distance relative to their own centred replay. An additional check using absolute, unrounded movement lengths gave the same 19 mm cutoff for the 21 users.
Across the 361 pairs, the change in remaining budget at 21 mm ranged from zero on the centreline to 0.52 mm. At 22 mm it reached 0.53 mm. On the limiting pair, increasing the sampling from 64 to 512 intervals changed the pre-rounding reserve by less than 0.01 mm at both lengths. The stored reading remained sensitive to the rounding of many short steps.
We checked complete returns with the same body, furniture and floor geometry, including two chair strokes at the starting seat and four at the destination. We also observed both readings on the exact same frames in 41 independent full-cycle replays across the two rooms, including 8 marked starts. Nine airflow errors, two exposure readings, 81 paired foot readings and 41 F1b chair placements remained in the original seat-choice test. These cutoffs describe the virtual users’ walking budgets on the tested grid. Physical walking comfort was outside the simulation.
C1 → N3 / SPARE WALKING DISTANCE
The earlier one-metre shortcut gave 21 more virtual profiles a suitable seat. We tested 21 through 30 mm in 1 mm steps against the 20 mm entrance. Each of three sampling settings covered the same 361 outward and return pairs in both rooms. The 64-interval replay reproduced the earlier 0.14 mm reserve and reached 1.50 mm at 30 mm, a gain of 1.36 mm. At 512 intervals the tightest reserve rose from -0.31 to 1.05 mm, a gain of 1.36 mm. Here 1 mm is an illustrative benchmark for spare walking distance.
| Entrance | Spare distance · 512 intervals | Gain per step · 512 | Pairs keeping all 21 · 512 | Spare distance · 64 | Spare distance · 8 |
|---|---|---|---|---|---|
| 20 mm | -0.31 mm | Reference | 360/361 | 0.14 mm | 0.25 mm |
| 21 mm | -0.10 mm | +0.21 mm | 360/361 | 0.32 mm | 0.43 mm |
| 22 mm | 0.08 mm | +0.18 mm | 361/361 | 0.50 mm | 0.61 mm |
| 23 mm | 0.26 mm | +0.17 mm | 361/361 | 0.65 mm | 0.76 mm |
| 24 mm | 0.36 mm | +0.10 mm | 361/361 | 0.80 mm | 0.91 mm |
| 25 mm | 0.52 mm | +0.16 mm | 361/361 | 0.94 mm | 1.04 mm |
| 26 mm | 0.65 mm | +0.13 mm | 361/361 | 1.07 mm | 1.17 mm |
| 27 mm | 0.79 mm | +0.14 mm | 361/361 | 1.18 mm | 1.29 mm |
| 28 mm | 0.89 mm | +0.10 mm | 361/361 | 1.29 mm | 1.40 mm |
| 29 mm | 0.99 mm | +0.10 mm | 361/361 | 1.41 mm | 1.50 mm |
| 30 mm | 1.05 mm | +0.06 mm | 361/361 | 1.50 mm | 1.60 mm |
Each row shows the smallest distance left among the original 21 gains. Values are displayed to two decimals. Seat decisions use the full numerical sum of the saved steps. The same profile set the limit throughout. Its most expensive trip was 9 mm to the walker’s left on the way out and 9 mm to their right on the way back. Both offsets are on the same side of the room. The densest replay gained 0.21 mm on the first step and 0.06 mm on the last.
In B′72 and B72 we applied the same 7,490 virtual profiles at each starting table, with their original scent preferences, sightline requirements and walking limits. Every whole-millimetre shift from −9 to +9 was tested independently on each leg, giving 19 × 19 = 361 pairs. At eight and 64 intervals every new length retained the same 14 earlier and seven later C1 gains in both rooms. At 512 intervals the hardest pairing at 21 mm lost one of the seven recent gains to travel distance. All 21 held from 22 mm onward. All profiles who qualified before the shortcut kept a seat in every case. The F1b comparison retained its earlier result of 73 profiles without a suitable seat, with zero gains or losses.
Each cell is the smallest spare distance, in millimetres, among the 21 gains at 512 intervals. Rows are outward offsets and columns are return offsets. L and R follow the walker on each leg.
| Out ↓ / Back → | R9 | R8 | R7 | R6 | R5 | R4 | R3 | R2 | R1 | 0 | L1 | L2 | L3 | L4 | L5 | L6 | L7 | L8 | L9 |
|---|---|---|---|---|---|---|---|---|---|---|---|---|---|---|---|---|---|---|---|
| R9 | 35.38 | 37.90 | 40.33 | 42.71 | 45.00 | 47.23 | 49.40 | 51.49 | 53.52 | 55.69 | 57.31 | 59.10 | 60.84 | 62.47 | 64.07 | 65.58 | 67.02 | 68.38 | 69.71 |
| R8 | 34.05 | 36.57 | 39.00 | 41.38 | 43.67 | 45.90 | 48.07 | 50.16 | 52.18 | 54.36 | 55.98 | 57.76 | 59.51 | 61.14 | 62.74 | 64.25 | 65.69 | 67.04 | 68.38 |
| R7 | 32.70 | 35.21 | 37.64 | 40.02 | 42.32 | 44.55 | 46.71 | 48.81 | 50.83 | 53.01 | 54.63 | 56.41 | 58.16 | 59.79 | 61.39 | 62.90 | 64.34 | 65.69 | 67.02 |
| R6 | 31.25 | 33.77 | 36.20 | 38.58 | 40.88 | 43.10 | 45.27 | 47.37 | 49.39 | 51.57 | 53.19 | 54.97 | 56.71 | 58.35 | 59.94 | 61.45 | 62.90 | 64.25 | 65.58 |
| R5 | 29.74 | 32.26 | 34.69 | 37.07 | 39.37 | 41.60 | 43.76 | 45.86 | 47.88 | 50.06 | 51.68 | 53.46 | 55.20 | 56.84 | 58.43 | 59.94 | 61.39 | 62.74 | 64.07 |
| R4 | 28.15 | 30.66 | 33.09 | 35.47 | 37.77 | 40.00 | 42.16 | 44.26 | 46.28 | 48.46 | 50.08 | 51.86 | 53.61 | 55.24 | 56.84 | 58.35 | 59.79 | 61.14 | 62.47 |
| R3 | 26.51 | 29.03 | 31.46 | 33.84 | 36.14 | 38.36 | 40.53 | 42.63 | 44.65 | 46.83 | 48.45 | 50.23 | 51.97 | 53.61 | 55.20 | 56.71 | 58.16 | 59.51 | 60.84 |
| R2 | 24.77 | 27.29 | 29.72 | 32.10 | 34.39 | 36.62 | 38.79 | 40.88 | 42.90 | 45.08 | 46.70 | 48.49 | 50.23 | 51.86 | 53.46 | 54.97 | 56.41 | 57.76 | 59.10 |
| R1 | 22.99 | 25.51 | 27.94 | 30.32 | 32.61 | 34.84 | 37.01 | 39.10 | 41.12 | 43.30 | 44.92 | 46.70 | 48.45 | 50.08 | 51.68 | 53.19 | 54.63 | 55.98 | 57.31 |
| 0 | 21.37 | 23.88 | 26.31 | 28.69 | 30.99 | 33.22 | 35.38 | 37.48 | 39.50 | 41.68 | 43.30 | 45.08 | 46.83 | 48.46 | 50.06 | 51.57 | 53.01 | 54.36 | 55.69 |
| L1 | 19.19 | 21.71 | 24.14 | 26.52 | 28.81 | 31.04 | 33.21 | 35.30 | 37.32 | 39.50 | 41.12 | 42.90 | 44.65 | 46.28 | 47.88 | 49.39 | 50.83 | 52.18 | 53.52 |
| L2 | 17.17 | 19.69 | 22.12 | 24.49 | 26.79 | 29.02 | 31.19 | 33.28 | 35.30 | 37.48 | 39.10 | 40.88 | 42.63 | 44.26 | 45.86 | 47.37 | 48.81 | 50.16 | 51.49 |
| L3 | 15.07 | 17.59 | 20.02 | 22.40 | 24.69 | 26.92 | 29.09 | 31.19 | 33.21 | 35.38 | 37.01 | 38.79 | 40.53 | 42.16 | 43.76 | 45.27 | 46.71 | 48.07 | 49.40 |
| L4 | 12.90 | 15.42 | 17.85 | 20.23 | 22.53 | 24.76 | 26.92 | 29.02 | 31.04 | 33.22 | 34.84 | 36.62 | 38.36 | 40.00 | 41.60 | 43.10 | 44.55 | 45.90 | 47.23 |
| L5 | 10.68 | 13.19 | 15.62 | 18.00 | 20.30 | 22.53 | 24.69 | 26.79 | 28.81 | 30.99 | 32.61 | 34.39 | 36.14 | 37.77 | 39.37 | 40.88 | 42.32 | 43.67 | 45.00 |
| L6 | 8.38 | 10.90 | 13.33 | 15.71 | 18.00 | 20.23 | 22.40 | 24.49 | 26.52 | 28.69 | 30.32 | 32.10 | 33.84 | 35.47 | 37.07 | 38.58 | 40.02 | 41.38 | 42.71 |
| L7 | 6.00 | 8.52 | 10.95 | 13.33 | 15.62 | 17.85 | 20.02 | 22.12 | 24.14 | 26.31 | 27.94 | 29.72 | 31.46 | 33.09 | 34.69 | 36.20 | 37.64 | 39.00 | 40.33 |
| L8 | 3.57 | 6.09 | 8.52 | 10.90 | 13.19 | 15.42 | 17.59 | 19.69 | 21.71 | 23.88 | 25.51 | 27.29 | 29.03 | 30.66 | 32.26 | 33.77 | 35.21 | 36.57 | 37.90 |
| L9 | 1.05 | 3.57 | 6.00 | 8.38 | 10.68 | 12.90 | 15.07 | 17.17 | 19.19 | 21.37 | 22.99 | 24.77 | 26.51 | 28.15 | 29.74 | 31.25 | 32.70 | 34.05 | 35.38 |
Only the forward run at C1 was lengthened. The lateral shift still follows the same cubic easing curve and fades toward the aisle line over 180 mm. The two aisle endpoints, chair operations, furniture and seven tight stretches remain fixed. For each entrance we sampled both the rise and the fade at 64 intervals to match the 20 mm benchmark. The standard comparison used eight intervals. Both baseline values matched the previous study.
Only collision-free complete body and chair sweeps with an identical seated handoff at N3 were joined. With the floor, operating chairs and walking poses matched, each sweep was checked against the combined obstacles and occupied seats from the two rooms and both occupancy settings. A clear result covers each of those settings. Each length and sampling included three body shapes and 4,332 room, occupancy, body and direction combinations. Zero-drift paths used the unchanged centred movement.
The 20 mm control matched all four previously separate room and occupancy replays for each body and signed floor path, including frame hashes, leg lengths and chair strokes. We also directly replayed 176 trips in the individual rooms on the finer curves. These included 136 marked starts and unequal outward and return offsets. The direct distances agreed with the joined legs. Every group retained the home pose of the body and both chairs, including six 300 mm chair strokes per trip.
The smallest centreline-to-obstacle radius was 329.99 mm at every length. That leaves at least 29.99 mm beyond the 300 mm walking disc. Seat eligibility used the measured full trip, nine airflow errors, both seat readings, 81 paired foot readings and 41 F1b chair positions. The 18.5 + 5.5 m³/h air split and ±1.5° starting toe-angle range were held fixed.
For the 512-interval grid we reused the identical chair and seated motion and rebuilt the upright turns and translations along the changed entrance in each direction. We checked the whole range of standing body positions against the floor, both rooms’ furniture and all fixed occupants. The widest body and its turn padding fit inside this envelope with over 59 mm to spare along the changed segment. The distances reconstructed from the saved steps matched those from the original full-cycle engine at the precision shown. This checks agreement between the calculations. As a separate check, the table below follows just the limiting L9 out / R9 back trip in the occupied curved room at intermediate resolutions.
| Forward travel | 64 intervals | 128 intervals | 256 intervals | 512 intervals |
|---|---|---|---|---|
| 20 mm | 0.14 mm | 0.09 mm | -0.03 mm | -0.31 mm |
| 25 mm | 0.94 mm | 0.89 mm | 0.77 mm | 0.52 mm |
| 26 mm | 1.07 mm | 1.02 mm | 0.89 mm | 0.65 mm |
| 27 mm | 1.18 mm | 1.12 mm | 1.00 mm | 0.79 mm |
| 30 mm | 1.50 mm | 1.44 mm | 1.32 mm | 1.05 mm |
A negative value means this user exceeded their walking limit in the recorded trip even though the body and both chairs returned home. This happened at 20, 21 mm. Travel is summed from body positions saved to the nearest micrometre. Before rounding, the same 21 mm trip had 0.41 mm to spare. At 30 mm that figure was 1.58 mm, compared with 1.05 mm from the saved frames. Both measurements used the same centred-walk reference convention and identical collision checks. Rounding changed the 30 mm result by 0.53 mm, more than either margin near the 21–22 mm crossover. That crossover depends on how the movement is recorded.
The measured margins refer to the virtual profiles’ remaining walking distance. Walking comfort and real-world placement accuracy were not measured.
C1 → N3 / LENGTH OF THE ENTRANCE MOVEMENT
The walker starts on the aisle line at C1. A lead-in is the forward distance over which the walker eases sideways from zero to the chosen offset. Extending it from 6.35 mm to 20 mm adds 13.65 mm of forward run for the shift. Both ends of the aisle stay fixed. The same part of the route is traversed in reverse on the way back.
We used the same 7,490 virtual profiles in the straight and curved rooms. Previously, shortening the full trip by one metre had brought N3 within reach for 21 more profiles at C1. All 21, including the 14 earlier gains and the seven most recent gains, kept a qualifying seat with the 20 mm entrance. All profiles who qualified on the original route still qualified. F1b remained at 73 unmet cases, with zero gains or losses.
We screened every whole-millimetre length from 7 to 180 mm on the original cubic curve. Each of the 11 shorter settings from 7 through 17 mm was ruled out in both rooms by a full L9 out / R9 back replay for the body shape of the limiting profile. At 18, 19 and 20 mm we tested all 361 pairs. The original entrance and the 180 mm control reproduced the previous path shapes and reference movements. A positive budget in the tables is distance the profile could still afford. A negative value is the amount by which the full trip ran over its limit.
| Standard replay | Forward travel | Pairs keeping all 21 | Tightest travel budget | Original passes lost | Returns blocked |
|---|---|---|---|---|---|
| Original sharp entry | 6.35 mm | 358 / 361 | -5.219 mm | 0 | 0 |
| Just below first pass | 18 mm | 360 / 361 | -0.166 mm | 0 | 0 |
| First standard pass | 19 mm | 361 / 361 | +0.047 mm | 0 | 0 |
| Selected entry | 20 mm | 361 / 361 | +0.249 mm | 0 | 0 |
| Earlier gradual entry | 180 mm | 361 / 361 | +3.876 mm | 0 | 0 |
For the most demanding trip, the walker moves 9 mm to their left heading out and 9 mm to their right heading back. Because the walker turns around, those offsets follow the same side of the aisle. With no drift, the tightest of the newly qualifying profiles had 41.677 mm of trip budget to spare.
| Forward travel | Earlier sampling | Finer sampling | Finer check covered |
|---|---|---|---|
| 18 mm | -0.166 mm | -0.281 mm | L9 out / R9 back |
| 19 mm | +0.047 mm | -0.076 mm | L9 out / R9 back |
| 20 mm | +0.249 mm | +0.144 mm | 361 / 361 pairs |
The earlier simulation used eight sampling intervals on the entrance rise and its fade. We rebuilt those two parts with 64 intervals each, preserving the same curve, lateral target and other walking segments. At 19 mm the finer full-body replay exceeded the tightest budget by 0.076 mm. At 20 mm we reran all 361 pairs in both rooms with that finer entrance and found 0.144 mm remaining in the tightest case. Refining the sampling reduced this remaining margin by 0.105 mm, close to the margin itself. The 20 mm choice is the shortest whole-millimetre length to pass these two simulation settings.
Each cell gives the smallest remaining travel budget (mm) among the 21 gained profiles on the finer entrance. Rows give the outward offset and columns give the return offset in the walker’s direction. Both rooms gave the same results.
| Out ↓ / Back → | R9 | R8 | R7 | R6 | R5 | R4 | R3 | R2 | R1 | 0 | L1 | L2 | L3 | L4 | L5 | L6 | L7 | L8 | L9 |
|---|---|---|---|---|---|---|---|---|---|---|---|---|---|---|---|---|---|---|---|
| R9 | 34.42 | 37.05 | 39.61 | 42.09 | 44.48 | 46.79 | 49.00 | 51.16 | 53.20 | 55.19 | 56.99 | 58.76 | 60.45 | 62.03 | 63.53 | 64.94 | 66.27 | 67.53 | 68.70 |
| R8 | 33.25 | 35.88 | 38.43 | 40.91 | 43.31 | 45.62 | 47.83 | 49.99 | 52.02 | 54.01 | 55.81 | 57.59 | 59.27 | 60.86 | 62.36 | 63.76 | 65.10 | 66.35 | 67.53 |
| R7 | 31.99 | 34.62 | 37.18 | 39.66 | 42.05 | 44.36 | 46.57 | 48.73 | 50.77 | 52.76 | 54.56 | 56.33 | 58.02 | 59.60 | 61.10 | 62.51 | 63.84 | 65.10 | 66.27 |
| R6 | 30.66 | 33.29 | 35.84 | 38.32 | 40.72 | 43.03 | 45.24 | 47.40 | 49.43 | 51.42 | 53.23 | 55.00 | 56.68 | 58.27 | 59.77 | 61.17 | 62.51 | 63.76 | 64.94 |
| R5 | 29.25 | 31.88 | 34.43 | 36.92 | 39.31 | 41.62 | 43.83 | 45.99 | 48.03 | 50.02 | 51.82 | 53.59 | 55.27 | 56.86 | 58.36 | 59.77 | 61.10 | 62.36 | 63.53 |
| R4 | 27.75 | 30.38 | 32.93 | 35.42 | 37.81 | 40.12 | 42.33 | 44.49 | 46.53 | 48.52 | 50.32 | 52.09 | 53.77 | 55.36 | 56.86 | 58.27 | 59.60 | 60.86 | 62.03 |
| R3 | 26.17 | 28.79 | 31.35 | 33.83 | 36.22 | 38.54 | 40.75 | 42.90 | 44.94 | 46.93 | 48.73 | 50.50 | 52.19 | 53.77 | 55.27 | 56.68 | 58.02 | 59.27 | 60.45 |
| R2 | 24.48 | 27.11 | 29.66 | 32.15 | 34.54 | 36.85 | 39.06 | 41.22 | 43.26 | 45.25 | 47.05 | 48.82 | 50.50 | 52.09 | 53.59 | 55.00 | 56.33 | 57.59 | 58.76 |
| R1 | 22.71 | 25.34 | 27.89 | 30.38 | 32.77 | 35.08 | 37.29 | 39.45 | 41.49 | 43.48 | 45.28 | 47.05 | 48.73 | 50.32 | 51.82 | 53.23 | 54.56 | 55.81 | 56.99 |
| 0 | 20.91 | 23.54 | 26.09 | 28.58 | 30.97 | 33.28 | 35.49 | 37.65 | 39.69 | 41.68 | 43.48 | 45.25 | 46.93 | 48.52 | 50.02 | 51.42 | 52.76 | 54.01 | 55.19 |
| L1 | 18.92 | 21.55 | 24.10 | 26.59 | 28.98 | 31.29 | 33.50 | 35.66 | 37.70 | 39.69 | 41.49 | 43.26 | 44.94 | 46.53 | 48.03 | 49.43 | 50.77 | 52.02 | 53.20 |
| L2 | 16.88 | 19.51 | 22.06 | 24.55 | 26.94 | 29.25 | 31.46 | 33.62 | 35.66 | 37.65 | 39.45 | 41.22 | 42.90 | 44.49 | 45.99 | 47.40 | 48.73 | 49.99 | 51.16 |
| L3 | 14.72 | 17.35 | 19.91 | 22.39 | 24.78 | 27.09 | 29.30 | 31.46 | 33.50 | 35.49 | 37.29 | 39.06 | 40.75 | 42.33 | 43.83 | 45.24 | 46.57 | 47.83 | 49.00 |
| L4 | 12.51 | 15.14 | 17.70 | 20.18 | 22.57 | 24.88 | 27.09 | 29.25 | 31.29 | 33.28 | 35.08 | 36.85 | 38.54 | 40.12 | 41.62 | 43.03 | 44.36 | 45.62 | 46.79 |
| L5 | 10.20 | 12.83 | 15.38 | 17.87 | 20.26 | 22.57 | 24.78 | 26.94 | 28.98 | 30.97 | 32.77 | 34.54 | 36.22 | 37.81 | 39.31 | 40.72 | 42.05 | 43.31 | 44.48 |
| L6 | 7.81 | 10.44 | 12.99 | 15.47 | 17.87 | 20.18 | 22.39 | 24.55 | 26.59 | 28.58 | 30.38 | 32.15 | 33.83 | 35.42 | 36.92 | 38.32 | 39.66 | 40.91 | 42.09 |
| L7 | 5.33 | 7.95 | 10.51 | 12.99 | 15.38 | 17.70 | 19.91 | 22.06 | 24.10 | 26.09 | 27.89 | 29.66 | 31.35 | 32.93 | 34.43 | 35.84 | 37.18 | 38.43 | 39.61 |
| L8 | 2.77 | 5.40 | 7.95 | 10.44 | 12.83 | 15.14 | 17.35 | 19.51 | 21.55 | 23.54 | 25.34 | 27.11 | 28.79 | 30.38 | 31.88 | 33.29 | 34.62 | 35.88 | 37.05 |
| L9 | 0.14 | 2.77 | 5.33 | 7.81 | 10.20 | 12.51 | 14.72 | 16.88 | 18.92 | 20.91 | 22.71 | 24.48 | 26.17 | 27.75 | 29.25 | 30.66 | 31.99 | 33.25 | 34.42 |
Each leg used 19 integer offsets from −9 to +9 mm, including zero. Each entrance panel combined all 361 pairs in two rooms, two occupancy settings and three body shapes. Legs were joined only at an identical fully seated body and chair state at N3. Zero offset reproduced the earlier centred route. At 20 mm the tightest centreline-to-obstacle distance across the finer panel was 330.0 mm, leaving 30.0 mm beyond the 300 mm modelled walking disc.
Full-cycle swept-body checks included sitting, rising, all six 300 mm chair strokes and restoration of the original body and chair positions. At the two standard boundary lengths we replayed 96 marked-start trips. At 19 mm we also directly replayed 36 mixed-direction trips. At 20 mm we checked all 48 archived starting configurations at L9/R9 on both sampling settings, as well as L8/R9 and L9/R8 with marked starts on the finer curve. All agreed with the combined leg measurements. We ran the critical full returns at all three lengths on the finer curves with the original collision engine in the occupied curved room. Its 20 mm return length matched the finer all-pairs panel.
The other tight segments, the 180 mm fade back toward the line, the 18.5 + 5.5 m³/h air split, initial toe-angle range of ±1.5°, furniture and individual preferences stayed fixed. A longer rise moves the start of the fade forward. Seat choices were checked under nine airflow errors, both seat readings, all 81 paired foot readings and all 41 F1b chair positions.
As a separate sensitivity check we changed only the initial rise to a quintic easing curve and used 32 sampling intervals on the rise and fade. On the L9/R9 full replay in the occupied curved room, the tightest profile was 0.121 mm over budget at 22 mm and 0.048 mm inside at 23 mm. This single-pair check shows why the 20 mm result is specific to the tested cubic movement. Walking comfort was not measured.
C1 → N3 / ONE-MILLIMETRE TESTS
In each of the two 72-seat rooms, we tested the same 7,490 virtual profiles from each starting table. At C1, a one-metre shorter round trip had put a suitable seat within reach for 21 more profiles. The largest tested whole-millimetre mark that kept all 21 for every direction pairing was 8 mm. Everyone who qualified on the original route also kept a seat.
Each row includes every integer offset up to that limit. Going out and coming back can have different offsets, including zero. At 8 mm this gives 17 positions per leg and 289 pairs per entrance. B′72 and B72 gave identical results for the same profiles.
| Whole-mm limit on each leg | Gradual entrance · all 21 retained | Sharp entrance · all 21 retained |
|---|---|---|
| ±5 mm | 121 / 121 | 121 / 121 |
| ±6 mm | 169 / 169 | 169 / 169 |
| ±7 mm | 225 / 225 | 225 / 225 |
| ±8 mm | 289 / 289 | 289 / 289 |
| ±9 mm | 361 / 361 | 358 / 361 |
| ±10 mm | 440 / 441 | 431 / 441 |
With no sideways drift, the tightest of the 21 travel budgets had 41.68 mm to spare. At L8 out and R8 back with a sharp entrance, 0.78 mm remained. At L9 out and R9 back, the same profile exceeded its budget by 5.22 mm. The three failing pairs were L8 out / R9 back, L9 out / R9 back, L9 out / R8 back. All three affected that same profile in both rooms. Left on the way out and right on the way back put the walker on the same side of the room.
| Entrance | Going out | Coming back | Extra trip distance | Smallest spare distance | Gains retained |
|---|---|---|---|---|---|
| Gradual | L9 | R9 | 37.80 mm | +3.88 mm | 21 / 21 |
| Gradual | L10 | R10 | 42.36 mm | -0.68 mm | 20 / 21 |
| Sharp | L8 | R8 | 40.90 mm | +0.78 mm | 21 / 21 |
| Sharp | L9 | R9 | 46.90 mm | -5.22 mm | 20 / 21 |
L and R mean left and right in the walker’s direction of travel. Positive spare distance is inside the profile’s limit. All 14 earlier half-metre gains survived the entire ±10 mm grid. Losses came from the seven more recent gains. F1b stayed at 73 profiles without a suitable seat, with zero gains or losses.
Each cell counts how many of the 21 still qualified. Rows give the outward offset and columns the return offset, in millimetres.
| Out ↓ / Back → | R10 | R9 | R8 | R7 | R6 | R5 | R4 | R3 | R2 | R1 | 0 | L1 | L2 | L3 | L4 | L5 | L6 | L7 | L8 | L9 | L10 |
|---|---|---|---|---|---|---|---|---|---|---|---|---|---|---|---|---|---|---|---|---|---|
| R10 | 21 | 21 | 21 | 21 | 21 | 21 | 21 | 21 | 21 | 21 | 21 | 21 | 21 | 21 | 21 | 21 | 21 | 21 | 21 | 21 | 21 |
| R9 | 21 | 21 | 21 | 21 | 21 | 21 | 21 | 21 | 21 | 21 | 21 | 21 | 21 | 21 | 21 | 21 | 21 | 21 | 21 | 21 | 21 |
| R8 | 21 | 21 | 21 | 21 | 21 | 21 | 21 | 21 | 21 | 21 | 21 | 21 | 21 | 21 | 21 | 21 | 21 | 21 | 21 | 21 | 21 |
| R7 | 21 | 21 | 21 | 21 | 21 | 21 | 21 | 21 | 21 | 21 | 21 | 21 | 21 | 21 | 21 | 21 | 21 | 21 | 21 | 21 | 21 |
| R6 | 21 | 21 | 21 | 21 | 21 | 21 | 21 | 21 | 21 | 21 | 21 | 21 | 21 | 21 | 21 | 21 | 21 | 21 | 21 | 21 | 21 |
| R5 | 21 | 21 | 21 | 21 | 21 | 21 | 21 | 21 | 21 | 21 | 21 | 21 | 21 | 21 | 21 | 21 | 21 | 21 | 21 | 21 | 21 |
| R4 | 21 | 21 | 21 | 21 | 21 | 21 | 21 | 21 | 21 | 21 | 21 | 21 | 21 | 21 | 21 | 21 | 21 | 21 | 21 | 21 | 21 |
| R3 | 21 | 21 | 21 | 21 | 21 | 21 | 21 | 21 | 21 | 21 | 21 | 21 | 21 | 21 | 21 | 21 | 21 | 21 | 21 | 21 | 21 |
| R2 | 21 | 21 | 21 | 21 | 21 | 21 | 21 | 21 | 21 | 21 | 21 | 21 | 21 | 21 | 21 | 21 | 21 | 21 | 21 | 21 | 21 |
| R1 | 21 | 21 | 21 | 21 | 21 | 21 | 21 | 21 | 21 | 21 | 21 | 21 | 21 | 21 | 21 | 21 | 21 | 21 | 21 | 21 | 21 |
| 0 | 21 | 21 | 21 | 21 | 21 | 21 | 21 | 21 | 21 | 21 | 21 | 21 | 21 | 21 | 21 | 21 | 21 | 21 | 21 | 21 | 21 |
| L1 | 21 | 21 | 21 | 21 | 21 | 21 | 21 | 21 | 21 | 21 | 21 | 21 | 21 | 21 | 21 | 21 | 21 | 21 | 21 | 21 | 21 |
| L2 | 21 | 21 | 21 | 21 | 21 | 21 | 21 | 21 | 21 | 21 | 21 | 21 | 21 | 21 | 21 | 21 | 21 | 21 | 21 | 21 | 21 |
| L3 | 21 | 21 | 21 | 21 | 21 | 21 | 21 | 21 | 21 | 21 | 21 | 21 | 21 | 21 | 21 | 21 | 21 | 21 | 21 | 21 | 21 |
| L4 | 21 | 21 | 21 | 21 | 21 | 21 | 21 | 21 | 21 | 21 | 21 | 21 | 21 | 21 | 21 | 21 | 21 | 21 | 21 | 21 | 21 |
| L5 | 21 | 21 | 21 | 21 | 21 | 21 | 21 | 21 | 21 | 21 | 21 | 21 | 21 | 21 | 21 | 21 | 21 | 21 | 21 | 21 | 21 |
| L6 | 21 | 21 | 21 | 21 | 21 | 21 | 21 | 21 | 21 | 21 | 21 | 21 | 21 | 21 | 21 | 21 | 21 | 21 | 21 | 21 | 21 |
| L7 | 21 | 21 | 21 | 21 | 21 | 21 | 21 | 21 | 21 | 21 | 21 | 21 | 21 | 21 | 21 | 21 | 21 | 21 | 21 | 21 | 21 |
| L8 | 21 | 21 | 21 | 21 | 21 | 21 | 21 | 21 | 21 | 21 | 21 | 21 | 21 | 21 | 21 | 21 | 21 | 21 | 21 | 21 | 21 |
| L9 | 21 | 21 | 21 | 21 | 21 | 21 | 21 | 21 | 21 | 21 | 21 | 21 | 21 | 21 | 21 | 21 | 21 | 21 | 21 | 21 | 21 |
| L10 | 20 | 21 | 21 | 21 | 21 | 21 | 21 | 21 | 21 | 21 | 21 | 21 | 21 | 21 | 21 | 21 | 21 | 21 | 21 | 21 | 21 |
| Out ↓ / Back → | R10 | R9 | R8 | R7 | R6 | R5 | R4 | R3 | R2 | R1 | 0 | L1 | L2 | L3 | L4 | L5 | L6 | L7 | L8 | L9 | L10 |
|---|---|---|---|---|---|---|---|---|---|---|---|---|---|---|---|---|---|---|---|---|---|
| R10 | 21 | 21 | 21 | 21 | 21 | 21 | 21 | 21 | 21 | 21 | 21 | 21 | 21 | 21 | 21 | 21 | 21 | 21 | 21 | 21 | 21 |
| R9 | 21 | 21 | 21 | 21 | 21 | 21 | 21 | 21 | 21 | 21 | 21 | 21 | 21 | 21 | 21 | 21 | 21 | 21 | 21 | 21 | 21 |
| R8 | 21 | 21 | 21 | 21 | 21 | 21 | 21 | 21 | 21 | 21 | 21 | 21 | 21 | 21 | 21 | 21 | 21 | 21 | 21 | 21 | 21 |
| R7 | 21 | 21 | 21 | 21 | 21 | 21 | 21 | 21 | 21 | 21 | 21 | 21 | 21 | 21 | 21 | 21 | 21 | 21 | 21 | 21 | 21 |
| R6 | 21 | 21 | 21 | 21 | 21 | 21 | 21 | 21 | 21 | 21 | 21 | 21 | 21 | 21 | 21 | 21 | 21 | 21 | 21 | 21 | 21 |
| R5 | 21 | 21 | 21 | 21 | 21 | 21 | 21 | 21 | 21 | 21 | 21 | 21 | 21 | 21 | 21 | 21 | 21 | 21 | 21 | 21 | 21 |
| R4 | 21 | 21 | 21 | 21 | 21 | 21 | 21 | 21 | 21 | 21 | 21 | 21 | 21 | 21 | 21 | 21 | 21 | 21 | 21 | 21 | 21 |
| R3 | 21 | 21 | 21 | 21 | 21 | 21 | 21 | 21 | 21 | 21 | 21 | 21 | 21 | 21 | 21 | 21 | 21 | 21 | 21 | 21 | 21 |
| R2 | 21 | 21 | 21 | 21 | 21 | 21 | 21 | 21 | 21 | 21 | 21 | 21 | 21 | 21 | 21 | 21 | 21 | 21 | 21 | 21 | 21 |
| R1 | 21 | 21 | 21 | 21 | 21 | 21 | 21 | 21 | 21 | 21 | 21 | 21 | 21 | 21 | 21 | 21 | 21 | 21 | 21 | 21 | 21 |
| 0 | 21 | 21 | 21 | 21 | 21 | 21 | 21 | 21 | 21 | 21 | 21 | 21 | 21 | 21 | 21 | 21 | 21 | 21 | 21 | 21 | 21 |
| L1 | 21 | 21 | 21 | 21 | 21 | 21 | 21 | 21 | 21 | 21 | 21 | 21 | 21 | 21 | 21 | 21 | 21 | 21 | 21 | 21 | 21 |
| L2 | 21 | 21 | 21 | 21 | 21 | 21 | 21 | 21 | 21 | 21 | 21 | 21 | 21 | 21 | 21 | 21 | 21 | 21 | 21 | 21 | 21 |
| L3 | 21 | 21 | 21 | 21 | 21 | 21 | 21 | 21 | 21 | 21 | 21 | 21 | 21 | 21 | 21 | 21 | 21 | 21 | 21 | 21 | 21 |
| L4 | 21 | 21 | 21 | 21 | 21 | 21 | 21 | 21 | 21 | 21 | 21 | 21 | 21 | 21 | 21 | 21 | 21 | 21 | 21 | 21 | 21 |
| L5 | 21 | 21 | 21 | 21 | 21 | 21 | 21 | 21 | 21 | 21 | 21 | 21 | 21 | 21 | 21 | 21 | 21 | 21 | 21 | 21 | 21 |
| L6 | 21 | 21 | 21 | 21 | 21 | 21 | 21 | 21 | 21 | 21 | 21 | 21 | 21 | 21 | 21 | 21 | 21 | 21 | 21 | 21 | 21 |
| L7 | 20 | 21 | 21 | 21 | 21 | 21 | 21 | 21 | 21 | 21 | 21 | 21 | 21 | 21 | 21 | 21 | 21 | 21 | 21 | 21 | 21 |
| L8 | 20 | 20 | 21 | 21 | 21 | 21 | 21 | 21 | 21 | 21 | 21 | 21 | 21 | 21 | 21 | 21 | 21 | 21 | 21 | 21 | 21 |
| L9 | 20 | 20 | 20 | 21 | 21 | 21 | 21 | 21 | 21 | 21 | 21 | 21 | 21 | 21 | 21 | 21 | 21 | 21 | 21 | 21 | 21 |
| L10 | 20 | 20 | 20 | 20 | 21 | 21 | 21 | 21 | 21 | 21 | 21 | 21 | 21 | 21 | 21 | 21 | 21 | 21 | 21 | 21 | 21 |
The tight portions total 1.17 m one way. We kept the aisle endpoints fixed. At the entrance the gradual shift reaches its target over 180 mm. The sharp shift reaches it within 6.35 mm. On return the walker follows each shape in reverse. The tightest centreline clearance within the common ±8 mm grid was 331.0 mm, leaving 31.0 mm beyond the 300 mm walking disc. A separate swept-body check covered the moving body and furniture. Every pairing through ±10 mm cleared and restored the body and both chairs.
We measured 441 direction pairs for each entrance in each room. Three body shapes and two occupancy settings produced 10,584 combined movement checks. Outward and return legs were joined only at an identical seated body and chair state at N3. The zero-offset controls reproduced the centred route. We also ran 288 complete marked-start trips for the boundary checks, including mixed directions. Their lengths agreed with the joined results to within 0.00001 mm. The checks included six 300 mm chair strokes per full trip. We directly replayed the two unequal-leg counterexamples in 56 more complete trips, and the original collision engine reproduced the same marked movement frames at L8/R8 and L9/R9 in the curved room.
Seat eligibility used the measured distances, the same individual travel budgets, nine airflow errors, both seat readings, 81 paired foot readings and all 41 F1b chair positions. Furniture, seat count and the 18.5 + 5.5 m³/h air split were held fixed. The cutoffs apply to the sampled whole-millimetre paths in this simulation.
C1 → N3 / WALKING OFF THE LINE
The same 7,490 virtual profiles started at the shared table in each 72-seat room. On the shorter route, 21 profiles who previously had no suitable seat could reach N3 and return. At every tested pairing up to 5 mm off line they all kept that option. Up to 10 mm, 20–21 kept it. Up to 20 mm, 19–21 did. All 14 gains from the half-metre route held throughout. Everyone who qualified on the original route still qualified.
On the marked line the smallest centreline-to-obstacle distance was 337.3 mm. With a 20 mm shift to the right on the outward walk it fell to 319.0 mm. That left 19.0 mm outside the 300 mm walking disc. The disc cleared in every trial. A separate three-dimensional sweep checked the moving body, other occupants and both chairs. Every trip finished with the body and both chairs back in their initial states.
| Entry | Pairs | Below original clearance | Below clearance, all 21 kept | Pairs losing 1–2 of the 21 | Blocked returns |
|---|---|---|---|---|---|
| Gradual | 49 | 33 | 33 | 8 | 0 |
| Rapid | 49 | 45 | 31 | 14 | 0 |
Each row describes 49 signed outward and return combinations, including zero. The columns can overlap. In the gradual test, eight pairs exceeded at least one profile’s distance limit even though they kept the original clearance. In the rapid test, all fourteen pairs that lost a gain also reduced the clearance. Both rooms gave the same results.
Read down for the outward leg and across for the return. L and R mean the walker’s own left and right in millimetres, and 0 means on the line. The same side of the room changes from left to right when the walker turns back. We sampled 0, 5, 10 and 20 mm on either side, so the reported ranges describe those discrete positions. Each cell counts how many of the original 21 gains remained. The same profiles gained or lost in both rooms across all nine airflow errors and both ways of reading scent exposure at a seat.
| Out ↓ / Back → | R20 | R10 | R5 | 0 | L5 | L10 | L20 |
|---|---|---|---|---|---|---|---|
| R20 | 21 | 21 | 21 | 21 | 21 | 21 | 21 |
| R10 | 21 | 21 | 21 | 21 | 21 | 21 | 21 |
| R5 | 21 | 21 | 21 | 21 | 21 | 21 | 21 |
| 0 | 20 | 21 | 21 | 21 | 21 | 21 | 21 |
| L5 | 19 | 21 | 21 | 21 | 21 | 21 | 21 |
| L10 | 19 | 20 | 21 | 21 | 21 | 21 | 21 |
| L20 | 19 | 19 | 19 | 20 | 21 | 21 | 21 |
| Out ↓ / Back → | R20 | R10 | R5 | 0 | L5 | L10 | L20 |
|---|---|---|---|---|---|---|---|
| R20 | 20 | 21 | 21 | 21 | 21 | 21 | 21 |
| R10 | 20 | 21 | 21 | 21 | 21 | 21 | 21 |
| R5 | 20 | 21 | 21 | 21 | 21 | 21 | 21 |
| 0 | 19 | 21 | 21 | 21 | 21 | 21 | 21 |
| L5 | 19 | 21 | 21 | 21 | 21 | 21 | 21 |
| L10 | 19 | 20 | 21 | 21 | 21 | 21 | 21 |
| L20 | 19 | 19 | 19 | 19 | 20 | 20 | 20 |
Going 20 mm left and returning 20 mm right added 91.6 mm to the gradual trip and 119.1 mm to the rapid trip. Two of the seven most recent gains fell outside their walking limits in each case. The smallest spare travel allowance among the 21 on the centred route was 41.7 mm. Some shorter pairings gave a seat to up to two further profiles with the gradual entry and one with the rapid entry. F1b stayed at 73 profiles without a suitable seat, with zero gains or losses.
The tight portions are the places where the centred line runs within 5 mm of its minimum clearance. They form seven separate intervals along a 4.68 m aisle walk. The first ends only 6.35 mm from the fixed C1 aisle endpoint. The gradual path reaches its sideways target over 180 mm at this entrance. The rapid path reaches the same target in the first 6.35 mm. On the return these shapes are traversed in reverse. The endpoints are fixed in both tests, so the offset is zero at the endpoint itself.
We applied a smooth lateral offset perpendicular to the local walking line. The offset reaches full amplitude across the other six intervals, with 180 mm transitions outside each group. Close intervals share one shift. We measured clearance on each complete piecewise-linear path, including the transitions and the two chair sweeps. The original and half-metre aisle lines were also measured as geometric controls at corresponding fractions of aisle length.
| Going out | Same floor side coming back | Gradual entry | Rapid entry |
|---|---|---|---|
| R20 | L20 | 319.0 mm | 319.0 mm |
| R10 | L10 | 329.0 mm | 329.0 mm |
| R5 | L5 | 334.0 mm | 334.0 mm |
| 0 | 0 | 337.3 mm | 337.3 mm |
| L5 | R5 | 337.3 mm | 337.3 mm |
| L10 | R10 | 337.3 mm | 335.8 mm |
| L20 | R20 | 337.3 mm | 329.9 mm |
Each entry shape pairs seven outward positions with seven independent return positions, in two rooms, two occupancy settings and three body profiles. We checked the turns and walking segments with swept body volumes. Legs were combined only at identical seated body and chair coordinates at N3. Twelve zero-offset cycles reproduced the earlier full-motion hashes. An additional 192 end-to-end replays with marked starts checked the joined distances and the return, including all six 300 mm chair strokes. The 20° standing approaches, the ±1.5° initial toe-angle range, furniture, air split of 18.5 + 5.5 m³/h and the original walking limits were held fixed.
Seat choices used the measured length, the same 288 airflow fields, both seat readings, all 81 paired foot readings and all 41 checked F1b chair positions. These results cover the specified simulated paths. Travel budgets count distance. Going 20 mm left and coming back 20 mm right increased cumulative modelled turning for the centred broader body from 1,195° to 1,413° in the gradual test and to 1,592° in the rapid test. The sharper turn at the entrance was a stress test of the geometry. Human gait and comfort have not been measured.
C1 TO N3 / FIXED AISLE ENDPOINTS
With the 18.5 + 5.5 m³/h split and each case’s starting toe-angle error halved to the ±1.5° range, the new C1-N3 trip saved 1.00022 m against the original. The earlier fourteen IDs and the seven additional IDs matched the exact one-metre prediction. Every previously passing case retained a seat in both layouts.
| C1-N3 route | Full marked trip | C1 gains vs original | C1 still unmet |
|---|---|---|---|
| Original | 17.811 m | — | 122 |
| Half-metre saving | 17.311 m | 14 | 108 |
| One-metre saving | 16.811 m | 21 | 101 |
We screened five shared aisle graphs against the original floor, furniture and operating-chair sweeps. The best sampled aisle line alone saved 0.608 m on a restored return. Replanning the standing approaches with a fixed body heading brought a tested candidate to 0.9835 m. For the selected one-metre route we blended the aisle line back toward the original and used a 20° standing turn on each chair approach.
Of the measured saving on the selected route, about 0.580 m came from the aisle and its transitions, 0.225 m from the C1 chair approach and 0.195 m from the N3 chair approach. These figures include travel in both directions. Only the C1-N3 movement script uses the revised steps. The original seated, standing handoff and grip poses, the furniture and the other trips in the choice menu are preserved.
The rings on the plan are at (11.90, 5.05) and (14.90, 3.20) m in both rooms. Their positions match the original coordinates exactly. The minimum horizontal distance from the aisle centreline to the floor boundary or nearest modelled obstacle was 337.275827 mm before and after. This leaves 37.3 mm beyond the 300 mm circulation-disc radius.
The new line runs close to the limit for longer. About 1.17 m of the one-way aisle walk lies within 5 mm of the minimum in both rooms, compared with about 0.03 m on the half-metre route. Separate swept-body tests at the two standing chair approaches passed with an extra 10 mm of horizontal padding on each axis, including the turns. This padding describes the standing transfers only.
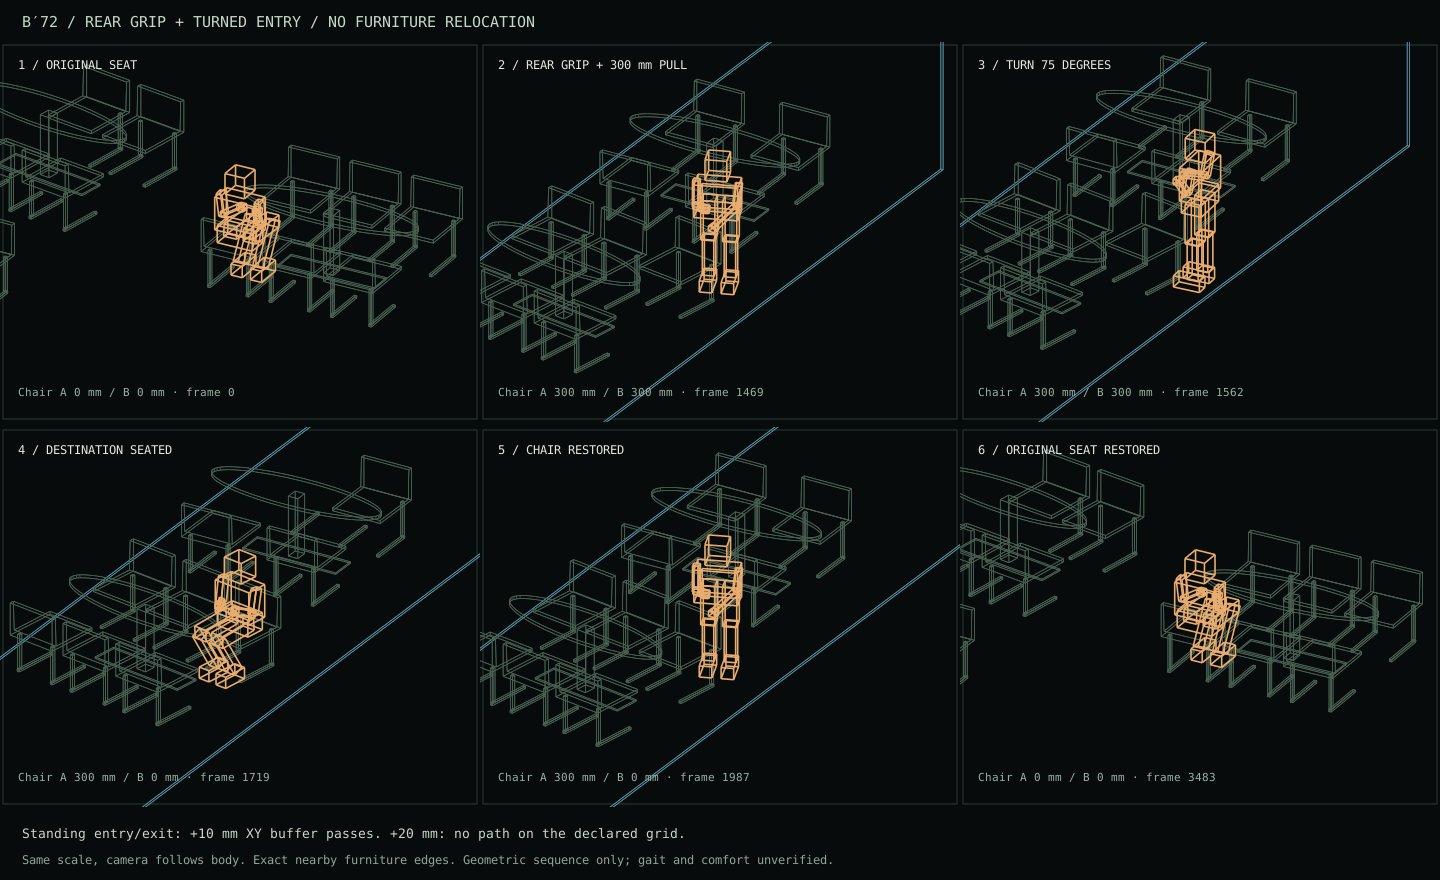
The C1 chair moved out 300 mm and back. At N3 the actor pulled the vacant chair out 300 mm, pushed it in while sitting, rose with it pulled out again and reset it before the walk home. Both chair positions and every body part returned to their starting coordinates. For the standard-height broader profile, cumulative rigid turning over the centred round trip was 1,827.3° on the original route, 1,213.0° on the half-metre route and 1,195.4° on this route, including the new standing turns. For each body profile, maximum arm-chain reach was identical on all three routes. It was 0.614 m for the nominal profile, 0.620 m for the standard-height broader profile and 0.677 m for the taller broader profile.
The route passed all 12 centred checks across three body profiles, two rooms and two occupancies. The 48 marked replays covered two rooms, two occupancies, two broader profiles, two mirrored starts and three attainable heading and correction combinations. At −1.5° the initial foot remained fixed. At +1.5° we tested both a fixed foot and an outward 2 mm correction. Each prefix joined the same centred full-body state and was reversed at the end. The smallest marked saving across those replays was 1.00022 m. A separate replay with the original collision checker reproduced the return trace.
| Room and seat reading | Settings passing | Earlier gains retained | Further gains | Losses vs half-metre |
|---|---|---|---|---|
| Straight B′72 · Nearest cell | 9 / 9 | 14 | 7 | 0 |
| Straight B′72 · Four-cell interpolation | 9 / 9 | 14 | 7 | 0 |
| Curved B72 · Nearest cell | 9 / 9 | 14 | 7 | 0 |
| Curved B72 · Four-cell interpolation | 9 / 9 | 14 | 7 | 0 |
We replayed the same 7,490 virtual cases at each starting table using the measured full-trip lengths and the original travel limits, exposure requests and reciprocal sightlines. At C1, 21 cases qualified relative to the original, including all 14 from the half-metre route and exactly the seven additional IDs from the one-metre screen. No cases became conditional. F1b remained at 73 unmet cases with zero gains or losses.
The replay used the same 288 air fields at the 0.5-second time step, all nine transfer errors, both spatial readings, both occupancies and the 81 paired foot-reading combinations. All 41 F1b chair positions were retained in the menus. The nearest new qualifier had 41.7 mm left in the travel budget. The checked movements are scripted simulations.
Previous study · the half-metre route and its fourteen gains
C1 TO N3 / FULL RETURN ROUTE
The earlier seat-choice test identified 14 C1 cases whose trip to N3 would fit their own travel budgets if it were 0.5 m shorter. We changed the aisle walk, measured the whole seated-to-seated return and replayed all 7,490 virtual cases at each origin. The same 14 case IDs now qualified across both rooms, both spatial readings and all nine operating errors. There were zero losses and zero cases left conditional.
The approach to N3 cuts across the bend into the final aisle. All original chair locations, pulling distances, grip positions and the two aisle endpoints are retained. Each one-way walk is about 0.25 m shorter. The narrowest centreline clearance on the revised aisle is 337.3 mm, including the operating chairs’ sweep outlines in the plan. The circulation disc used for this check has a 300 mm radius.
The actor pulled the original chair out by 300 mm, rose, walked to N3, pulled the vacant chair out by 300 mm and pushed it in while sitting. To return, the actor rose with the destination chair pulled out again, reset it, retraced the aisle and reseated at C1. Both chair displacements returned to zero. Every body part returned to its recorded initial vertices. The foot correction, when prompted, was reversed as part of the return.
The trace follows horizontal pelvis travel. From a centred start it measured 17.771 m before the change and 17.271 m after it. Including the mirrored marked start and its restoration gave 17.811 m and 17.311 m. The saving was 0.50002 m. The primary route used the same maximum hand reach of 0.620 m as the earlier route.
| Room and seat reading | Settings keeping the 14 predicted gains | Previously passing cases lost |
|---|---|---|
| Straight B′72 · Nearest cell | 9 / 9 | 0 |
| Straight B′72 · Four-cell interpolation | 9 / 9 | 0 |
| Curved B72 · Nearest cell | 9 / 9 | 0 |
| Curved B72 · Four-cell interpolation | 9 / 9 | 0 |
The smaller air split, 18.5 + 5.5 m³/h, used the 0.5-second air fields already verified for all nine signed transfer errors. Each seat retained its exposure, reciprocal views and occupancy rules. We changed only the C1-N3 trip length in the full choice menu and used each actor’s own travel limit. Among the 14 new qualifiers, the smallest amount left in anyone’s travel budget was 13.4 mm. The 7,490 F1b replays showed no gains or losses.
| Route | Full round trip | C1 gains | C1 still unmet |
|---|---|---|---|
| Earlier walk | 17.811 m | — | 122 |
| Same aisle endpoints | 17.311 m | 14 | 108 |
| Shifted aisle endpoints | 16.730 m | 23 | 99 |
A second traced route moved the standing points at the two ends of the walk while keeping the chairs in place. It saved 1.081 m and qualified 23 C1 cases, including the same 14. Its minimum centreline clearance fell to 301.4 mm. That leaves 1.4 mm beyond the 300 mm aisle-disc radius. The half-metre route above retains the earlier 37.3 mm of extra radial space.
The initial aisle search generated 154 shared paths and tested 32 in the full chair cycle for the broader, standard-height profile in the straight room at basic occupancy. The shortest surviving path was checked in both rooms. For the requested half-metre change, we also searched within the original aisle clearance, kept the original endpoints and measured the candidate in both rooms at basic and plus-five occupancy. A deliberately obstructed control failed on the outward walk.
Each of the three reported routes was checked from a centred start for three body profiles and in 48 complete marked cycles for the two broader profiles, both mirrored starts, both rooms and both occupancies. For each room, occupancy, body and mirror we replayed three attainable heading and correction pairs. At −1.5° the frozen rule kept the foot fixed. At +1.5° both a fixed foot and a triggered correction were tested. The rule cannot trigger a correction at −1.5° within the admitted read errors. Body and moving-chair envelopes between motion frames were tested for collision. Each marked prefix met the exact same full-body state as its centred cycle, and the same reversed prefix restored the starting pose. The existing full start-pose grid covers the remaining case starts. The moving body and chairs were separated from all 41 alternative F1b chair positions by at least 6.26 m along one plan axis.
The menu replay used 288 existing air fields and all 81 paired foot-read error combinations. Both occupancies and all 41 alternative F1b chair positions were retained, giving 5,904 menu contexts across both starting tables. The case counts describe the scripted simulation.
Previous study · the toe-angle target and the 14-case distance prediction
SEAT CHOICE / REMAINING UNMET CASES
At the adopted 18.5 + 5.5 m³/h split, 54 previously certain misses at each starting table gained a qualifying seat when each foot began closer to its assigned heading. These same case IDs qualified throughout the nine operating settings in straight B′72 and curved B72, under nearest-cell and four-cell readings. The five additional cases at each table that previously depended on the correction readings also qualified throughout.
Each starting table had 7,490 virtual cases. The original placement left 176 definite misses at C1 and 127 at F1b, with five more conditional cases at each. The tests narrowed the actor’s initial forward and inward errors from ±8 to ±4 mm, the heading error from ±3° to ±1.5°, or both. The assigned seated pose, the 52 mm inward foot mark and the 2 mm outward correction rule still applied.
| Initial placement | New certain gains | Still unmet |
|---|---|---|
| Position only | 53 | 122–123 |
| Toe angle only | 54 | 122 |
| Position and toe angle | 54 | 122 |
| Initial placement | New certain gains | Still unmet |
|---|---|---|
| Position only | 53 | 73–74 |
| Toe angle only | 54 | 73 |
| Position and toe angle | 54 | 73 |
The angle target recovered exactly the same 54 case IDs at each origin as the departure-only diagnostic. The three presets kept all previously available case outcomes, including the earlier 153 C1 and 37 F1b gains. All also passed the setup and slide checks for every triggered correction. The angle-only preset tied the combined preset at both starting tables while changing just one component. We selected it as the next simulated placement target. No physical guide was tested.
For this diagnosis we kept the original placement and relaxed one check at a time. Each entry counts definite misses that gained an alternative on every replay. The original seat retained its exposure and sightline conditions.
| Change tested on its own | C1 | F1b |
|---|---|---|
| Allow departure | 54 | 54 |
| Remove the trip limit | 120 | 71 |
| Waive the exposure request at destinations | 117 | 0 |
| Waive the requested group sightlines | 0 | 21 |
At C1, the 54 departure cases formed one group. A further 117 could gain a seat either through a shorter affordable trip or a destination meeting their exposure request. Three more responded only to the trip-limit waiver. At F1b, 54 responded to departure alone, 50 to the trip limit alone, and 21 to either the trip limit or group sightlines. At each table, the final two required a combination of changes. Allowing departure and removing the trip limit together recovered both.
If the exposure request was also waived at the starting seat, all 176 definite C1 misses and all 127 definite F1b misses could qualify simply by staying. The table excludes that effect. Its overlapping totals describe alternative ways to help the same people.
With the angle target already applied, a 0.5 m shorter full trip to C1-N3 could add 14 certain cases if a verified route achieves that saving. The corresponding estimate for a 1 m saving is 21. The next route test is to find that first 0.5 m while preserving the chair motions and the complete return. Those distances are targets for a new trace.
At F1b-N1 a verified third reciprocal sightline could add 21 certain cases beyond the angle target. In the earlier geometry the third group member could not face both the fixed board and this destination within the tested viewing range. An alternative seat or viewpoint needs its own sightline and return checks before those cases can count as design gains.
The comparison reused all 288 air fields for the nine error settings at a uniform 0.5-second step. The two readouts used the same fields. Each complete seat menu used the most demanding destination-to-start ratios across 16 grid and operating conditions and both sampling heights. Both occupancy settings, the same two broader body profiles, both mirrored starts and all 41 alternative positions of the F1b destination chair were carried forward. C1 kept the same route costs and seat menu across those chair positions.
For each actor we paired the same two position and angle read errors before and after the placement change. The frozen foot-correction rule was evaluated again at the changed starting pose for all 81 read pairs. Integer pose errors were halved and rounded toward zero on the archived 1 mm and 0.05° grids. The mean absolute heading error went from 1.491° to 0.733°. Each comparison changes the initial placement assumed for the moving person. The returned route length and movement budget use the same definition as the earlier study.
A certain gain means the same previously definite miss passed under every paired reading and in every tested context. We tracked the five conditional cases separately and checked for losses among all 7,490 cases per origin. We replayed one set of 7,490 input profiles at each starting table. Each result is counted separately for its named origin.
Previous study · the full 0.5-second comparison of the two air splits
AIR TRANSFER / FULL 0.5-SECOND COMPARISON
Use 18.5 + 5.5 m³/h as the next simulated reference. Both candidates kept the exact earlier 153 C1 cases and 37 F1b cases at all nine signed error settings, in both rooms under both readings. The smaller change is sufficient under this uniform 0.5-second comparison; 19 + 5 retains a larger numerical margin.
The pair states how much outlets 1 and 3 redirect to outlet 4. At each nominal split we tested total transfers of 22.5, 24 and 25.5 m³/h in the original proportions. We then shifted −1, 0 or +1 m³/h to outlet 1’s contribution, with an equal opposite change at outlet 3. That is nine signed errors per split. The separately selected outlet remained at 540.54 m³/h and the zone total at 1,544.4 m³/h.
| Total to 4 | −1 | 0 | +1 |
|---|---|---|---|
| 22.5 | Keep | Keep | Keep |
| 24 | Keep | Keep | Keep |
| 25.5 | Keep | Keep | Keep |
| Total to 4 | −1 | 0 | +1 |
|---|---|---|---|
| 22.5 | Keep | Keep | Keep |
| 24 | Keep | Keep | Keep |
| 25.5 | Keep | Keep | Keep |
We replayed the same 7,490 virtual cases per starting table in each room, keeping the earlier C1 and F1b case identities fixed. C1 and F1b are starting tables in both rooms. A table entry counts settings that retained every case in both groups.
| Room and reading | 18.5 + 5.5 | 19 + 5 |
|---|---|---|
| Straight B′72 · Nearest cell | 9 / 9 | 9 / 9 |
| Straight B′72 · Four-cell interpolation | 9 / 9 | 9 / 9 |
| Curved B72 · Nearest cell | 9 / 9 | 9 / 9 |
| Curved B72 · Four-cell interpolation | 9 / 9 | 9 / 9 |
Both splits kept all 153 C1 and all 37 F1b cases at every tested placement. No other previously qualifying case lost a seat, and no new cases qualified relative to the historical reference. Compared with the 2-second panel, 18.5 + 5.5 recovered the curved room’s 153 C1 cases at the one formerly failing setting under nearest-cell sampling. They are the same earlier cases, not additional people to add to 153. All other classifications were unchanged.
The table shows the highest seated destination-to-start tracer ratio across all nine errors, grid and operating conditions, both sample heights, and applicable chair placements, using nearest-cell sampling. The limit for a lower-exposure request is ≤90%; decisions use unrounded numbers.
| Destination and room | 18.5 + 5.5 | 19 + 5 |
|---|---|---|
| Straight B′72 · C1-N3 | 89.963610% | 89.962492% |
| Straight B′72 · F1b-N1 | 89.940318% | 89.940467% |
| Curved B72 · C1-N3 | 89.999925% | 89.998808% |
| Curved B72 · F1b-N1 | 89.957568% | 89.957716% |
The smallest margin was at curved C1-N3: 0.000075 percentage points with 18.5 + 5.5, compared with 0.001192 with 19 + 5. It occurred when the total rose to 25.5 m³/h and outlet 1 contributed 1 m³/h less than its proportional share. The smaller nominal split then became 18.65625 + 6.84375 m³/h. A separate direct calculation from the established starting state, with a tighter periodic closure criterion, agreed within 0.000000000 percentage points.
The earlier governing-field check at 0.125 s gave 89.999770% for the smaller split and remained below 90%. That check covers this field, not another full nine-setting panel. These small margins belong to the numerical model and do not establish an installation tolerance or a physical minimum.
Every setting used the same 16 grid and operating-condition combinations per room, seated sample heights of 0.55 and 1.65 m, and 41 alternative F1b chair positions. Nearest-cell and four-cell interpolation read the same air fields; each destination is divided by its starting-seat value from that same field. Complete seat menus, mobility limits, round trips and reciprocal views were inherited unchanged.
The study completed the 512 remaining room/condition fields and reproduced the 64 previously checked fields at 0.5 s. Reused terminal states served only as starting guesses: each new field was converged independently. Eight representative fields were also started from the original state, including four that had used predicted starting guesses. Every result near the limit received a separate tighter direct check. The historical zero-transfer, 2-second reference defines the earlier case groups; it is not counted as a new 0.5-second field. The nine errors are discrete model tests, not an estimate of error frequency.
Previous comparison · the 2-second result and its first 0.5-second check
AIR TRANSFER / MATCHED SEAT CHOICES
Of the two tested changes from 18 + 6, only 19 + 5 m³/h retained the same 153 C1 and 37 F1b cases at all nine settings in both rooms under both readings on the reference simulation. Compared with 18 + 6, outlet 1 contributed 1 m³/h more and outlet 3 contributed 1 m³/h less, leaving the total unchanged. Moving only 0.5 m³/h (18.5 + 5.5) still left one loss on the nearest-cell reading. Both splits passed all nine with four-cell interpolation.
Without any imposed error, both splits kept all earlier cases. The pair gives the amounts that outlets 1 and 3 redirected to outlet 4. Starting at 24 m³/h, we tested totals of 22.5, 24 and 25.5 in each split’s original proportions. At each total we shifted −1, 0 or +1 m³/h to outlet 1’s contribution, with the opposite change at outlet 3. Each cell compares the two rooms at the same actual flows.
| Total to 4 | −1 | 0 | +1 |
|---|---|---|---|
| 22.5 | Keep | Keep | Keep |
| 24 | Keep | Keep | Keep |
| 25.5 | Loss | Keep | Keep |
| Total to 4 | −1 | 0 | +1 |
|---|---|---|---|
| 22.5 | Keep | Keep | Keep |
| 24 | Keep | Keep | Keep |
| 25.5 | Keep | Keep | Keep |
We replayed the same 7,490 simulated cases per starting table in both rooms. C1 and F1b label starting tables in each room. For a case seeking lower exposure, a seat needed a simulated seated tracer dose at or below 90% of the dose at its starting seat, as well as a qualifying trip and view. The table counts settings where all 153 earlier C1 cases and all 37 earlier F1b cases kept a seat.
| Room and reading | 18.5 + 5.5 | 19 + 5 |
|---|---|---|
| Straight B′72 · Nearest cell | 9 of 9 | 9 of 9 |
| Straight B′72 · Four-cell interpolation | 9 of 9 | 9 of 9 |
| Curved B72 · Nearest cell | 8 of 9 | 9 of 9 |
| Curved B72 · Four-cell interpolation | 9 of 9 | 9 of 9 |
In the adverse cell, total flow was 25.5 m³/h and outlet 3 contributed 1 m³/h more than its proportional share. With 18.5 + 5.5 this gave an actual split of 18.65625 + 6.84375 m³/h. Only N3 in the curved room’s C1 menu crossed the limit. All 153 cases relying on it lost their qualifying seat under the nearest-cell reading. With 19 + 5 the same error produced 19.1875 + 6.3125 m³/h and all 153 retained it. All 37 F1b cases kept a seat at every tested chair position. Across the two panels, no other cases lost a seat and no new cases qualified.
These values are the curved C1 destination-to-start ratio in the adverse cell. The earlier 18 + 6 reference reached 90.00140% on the nearest-cell reading. We repeated the governing high-mixing field on its 250 mm grid at shorter time steps, reading both heights. At 0.5 s we also repeated all 16 grid and operating-condition combinations in each room at this one adverse setting, then replayed the full seat menus. The table shows nearest-cell values. Four-cell interpolation on the same field at 2 s gave 89.65527% for 18.5 + 5.5 and 89.65410% for 19 + 5. We used unrounded values to decide whether the seat qualified.
| Time step | 18.5 + 5.5 | 19 + 5 |
|---|---|---|
| 2 s | 90.000287% | 89.999170% |
| 1 s | 90.000072% | 89.998955% |
| 0.5 s | 89.999925% | 89.998808% |
| 0.25 s | 89.999829% | 89.998712% |
| 0.125 s | 89.999770% | 89.998653% |
At 0.5 s the smaller split first fell below 90% in this field. At 0.5 s, the full replay confirmed all 153 C1 and 37 F1b cases retained a qualifying seat at this adverse setting under both readings in both rooms, for both splits. The other eight signed errors in each panel were tested at the original 2 s step. The 1, 0.25 and 0.125 s checks in this table followed the governing field only. The 19 + 5 split stayed below the limit at all five time steps in this check. The comparison establishes the smallest passing change among the two nominated marks.
Each setting used 16 grid and operating-condition combinations in each room, with seated samples at 0.55 and 1.65 m and 41 alternative F1b chair positions. Both spatial readings use the same air field. Total zone supply stayed at 1,544.4 m³/h, and the separately selected outlet stayed at 540.54 m³/h. The nine settings are discrete tests. Their counts describe this model and do not estimate how often an error would occur in a room.
Previous study · the 18 + 6 reference and its remaining loss
AIR DISTRIBUTION / MATCHED SEAT CHOICES
Use 18 + 6 when both ways of reading the airflow simulation must pass. The same 153 cases from table C1 and 37 from table F1b kept a qualifying seat in both rooms at 8 of 9 settings. Only the nearest-cell reading at curved C1 separated the two splits. On that reading, 18 + 6 kept the seats at every setting that passed with 16 + 8 and at 3 additional settings. Interpolation passed all nine for both. The same simulated cases were tested each time.
Both reference splits supplied 24 m³/h to outlet 4. Rows vary the total by −1.5, 0 or +1.5 m³/h while preserving the original proportions. Columns shift −1, 0 or +1 m³/h from outlet 3’s contribution to outlet 1’s at that total. The centre cell is the reference split.
| Total to 4 | −1 | 0 | +1 |
|---|---|---|---|
| 22.5 | Pass | Pass | Pass |
| 24 | Loss | Pass | Pass |
| 25.5 | Loss | Loss | Loss |
| Total to 4 | −1 | 0 | +1 |
|---|---|---|---|
| 22.5 | Pass | Pass | Pass |
| 24 | Pass | Pass | Pass |
| 25.5 | Loss | Pass | Pass |
C1 labels one of the two starting tables. For people seeking lower exposure, a destination seat qualified when the modelled tracer dose there was at most 90% of the dose at their starting seat, under the same conditions. In the curved room, increasing total flow and shifting part of the contribution to outlet 3 each passed separately. Together they put C1 over the limit on the nearest-cell reading.
| Change from 18 + 6 | From 1 + from 3 (m³/h) | Curved C1 ratio, nearest cell | Curved C1 cases retained of 153 |
|---|---|---|---|
| Allocation error alone | 17 + 7 | 89.99772% | 153 |
| Total error alone | 19.125 + 6.375 | 89.99930% | 153 |
| Both errors | 18.125 + 7.375 | 90.00140% | 0 |
With the errors halved, the tested totals were 23.25, 24 and 24.75 m³/h. At each total we tested shifts of −0.5, 0 and +0.5 m³/h. Both rooms retained all 153 C1 and 37 F1b cases at all nine settings. The highest nearest-cell ratio at curved C1 was 89.99851% at 18.0625 + 6.6875 m³/h. Repeating its governing field with a 1 s time step gave 89.99830%.
The same 7,490 simulated cases per starting table were used in each room and replayed at each setting. B′72 has the straight boundary and B72 the curved one. The table counts settings where all 153 earlier C1 cases and all 37 earlier F1b cases retained a qualifying seat. We matched case identities across rooms. In every loss cell only C1-N3, the N3 destination seat for C1, changed eligibility in the curved room’s C1 seat menu. All 153 earlier C1 cases there depended on that seat and lost it together. All 37 F1b cases retained a qualifying seat at every setting. No other cases gained or lost one.
| Room | Readout | 16 + 8 | 18 + 6 | 18 + 6, half steps |
|---|---|---|---|---|
| Straight B′72 | Nearest cell | 9 of 9 | 9 of 9 | 9 of 9 |
| Straight B′72 | Interpolated | 9 of 9 | 9 of 9 | 9 of 9 |
| Curved B72 | Nearest cell | 5 of 9 | 8 of 9 | 9 of 9 |
| Curved B72 | Interpolated | 9 of 9 | 9 of 9 | 9 of 9 |
Both readings use the same simulated air field. One samples the nearest grid cell. The other interpolates between four cells. Interpolation kept both earlier groups at every tested setting. Every loss in the panels occurred at curved C1 under the nearest-cell reading.
Room geometry, furniture, the 103 mm S1 chair mark, sightlines and the previously verified return routes were fixed. The selected ceiling outlet stayed at 540.54 m³/h and the zone at 1,544.4 m³/h. Outlets 1 and 3 reduced their own supplies by exactly the increase at outlet 4. The two grids shown above and the half-step grid contained 25 distinct splits. At each split we tested 41 alternative F1b destination-chair positions. For each of the 16 grid and operating-condition combinations per room we read both heights, 0.55 and 1.65 m. Ratios compare seated exposure over a simulated cycle. The sampling grid establishes neither a continuous operating tolerance nor how often an error occurs in practice.
JOINT AIR TRANSFER / MATCHED SEAT CHOICES
The two individual last passes exceeded the seat limit when used together under the same readout in this simulation. The working outlet supplied 540.54 m³/h. Among the five other ceiling outlets, outlets 1 and 3 donated air to outlet 4. Each of those five began at 200.772 m³/h. Every increase at outlet 4 equalled the two reductions combined.
The single-donor study found 32.5 and 15.5 m³/h for the nearest-cell reading, and 195.5 and 99.5 m³/h for the interpolated reading. Each was the last tested pass with the other donor at zero. Here we solved each combined pair and read it both ways. Each exposure percentage is the destination dose divided by its own starting-seat dose under the same conditions. The table identifies the room, seat and grid at the highest ratio across the full test. A different field can set the peak when the readout changes. Case counts give the straight room (B′72) first and the curved room (B72) second. Ranges reflect the 41 F1b chair placements.
| From 1 + from 3 (m³/h) | Readout | Peak ratio | Room / seat / grid | C1 kept of 153 (B′72 / B72) | F1b kept of 37 (B′72 / B72) |
|---|---|---|---|---|---|
| 32.5 + 15.5 | Nearest cell | 90.06189% | B72 / C1-N3 / 250 mm | 0 / 0 | 37 / 37 |
| 32.5 + 15.5 | Interpolated | 89.87659% | B′72 / F1b-N1 / 62.5 mm | 153 / 153 | 37 / 37 |
| 195.5 + 99.5 | Nearest cell | 90.83332% | B72 / C1-N3 / 250 mm | 0 / 0 | 0–37 / 0–37 |
| 195.5 + 99.5 | Interpolated | 90.49085% | B72 / C1-N3 / 250 mm | 0 / 0 | 37 / 37 |
We tested totals of 24 and 147.5 m³/h, half the sum of the two individual passing amounts under their respective readouts. Each comparison increased the contribution from outlet 1 and reduced the contribution from outlet 3 by exactly the same amount. The rows below give the adjacent tested fail and pass for the stated readout, verified over 16 grid and airflow combinations per room.
| Total to 4 (m³/h) | Readout | From 1 + from 3 | B′72 maximum | B72 maximum | Both rooms pass? |
|---|---|---|---|---|---|
| 24 | Nearest cell | 15.5 + 8.5 | 89.96455% | 90.00088% | No |
| 24 | Nearest cell | 16 + 8 | 89.96350% | 89.99983% | Yes |
| 147.5 | Interpolated | 97 + 50.5 | 89.98647% | 90.00106% | No |
| 147.5 | Interpolated | 97.5 + 50 | 89.98526% | 89.99985% | Yes |
When each donor gave half of its own single-donor passing amount, 16.25 + 7.75 m³/h passed at 89.99930% with the nearest cell reading. The corresponding higher-total split of 97.75 + 49.75 m³/h passed at 89.99925% with the interpolated reading.
We ran an additional full check with 75% of each total coming from outlet 1. At 18 + 6 m³/h the highest nearest cell value was 89.99562%, leaving 0.00438 percentage points below the limit. At 110.625 + 36.875 m³/h the highest interpolated value was 89.96811%, leaving 0.03189 percentage points below the limit. Each split kept the 153 earlier C1 and 37 earlier F1b cases in each room under its specified readout.
We replayed every available seat choice for the same 7,490 simulated cases per starting table in each room, with the original preferences, travel limits, start poses and occupancies. C1 and F1b are separate starting tables. In the earlier redesign, 153 of the 7,490 cases starting at C1 and 37 of the 7,490 starting at F1b gained a suitable seat in each room. We used those same 7,490 F1b cases at each of the 41 chair placements. Repeating a placement or room adds no new cases. A count of zero in the C1 kept column means that none of the 153 earlier gains remained. Each pair of counts below is B′72 / B72.
| From 1 + from 3 (m³/h) | Readout | C1 kept of 153 (B′72 / B72) | F1b kept of 37 (B′72 / B72) |
|---|---|---|---|
| 15.5 + 8.5 | Nearest cell | 153 / 0 | 37 / 37 |
| 16 + 8 | Nearest cell | 153 / 153 | 37 / 37 |
| 97 + 50.5 | Interpolated | 153 / 0 | 37 / 37 |
| 97.5 + 50 | Interpolated | 153 / 153 | 37 / 37 |
At these four adjacent settings, no cases outside the earlier gains lost a suitable seat and no case newly qualified under the readout shown. At the interpolated passing split of 97.5 + 50 m³/h, the nearest-cell reading at the identical split instead retained 0 / 0 C1 gains (straight / curved). Among the 41 F1b placements, the nearest-cell reading lost all 37 earlier gains at 0 of 41 placements in the straight room and 1 of 41 in the curved room.
For 195.5 + 99.5 m³/h under the nearest cell reading, at starting table F1b, losses outside the earlier gains were 0–6 / 0–6 (straight / curved), and newly qualifying cases were 0 / 0.
At the 195.5 + 99.5 m³/h joint setting, F1b outcomes could also depend on chair position under the nearest-cell reading. In each room, all 37 kept a suitable seat at 40 of 41 placements and none kept one at the other 1.
A pass required C1-N3 and every one of the 41 placements of F1b-N1 to stay at or below 90% of the respective starting-seat dose. Within each field we divided the destination dose by the starting-seat dose at the same height, then took the highest unrounded ratio. For each full comparison we used six airflow conditions on each of the 250 and 100 mm horizontal grids, two on 125 mm, and high mixing on each of 83.33 and 62.5 mm. Both 0.55 and 1.65 m sampling heights were read at the nearest cell and by interpolation among four neighbouring cell centres.
For 32.5 + 15.5 m³/h (nearest cell), adding the two separate changes to the baseline ratio predicted 90.06184%. The joint solve gave 90.06189%, a difference of +0.00005 percentage points. For 195.5 + 99.5 m³/h (interpolated), adding the two separate changes to the baseline ratio predicted 90.48776%. The joint solve gave 90.49085%, a difference of +0.00309 percentage points. These comparisons used the same room, chair position, grid, condition, height and readout for the baseline, both single-donor runs and the joint run. At these points the two individual changes were close to additive. Each had already used almost all the available margin below 90%. The ratio tables use 2 s integration steps. Nearest cell at the first passing split was 89.99983% at 2 s and 89.99961% at 1 s. Interpolated at the first passing split was 89.99985% at 2 s and 89.99964% at 1 s. Nearest cell at the adjacent failing split was 90.00088% at 2 s and 90.00066% at 1 s. Interpolated at the adjacent failing split was 90.00106% at 2 s and 90.00085% at 1 s. All four pass/fail classifications held. The brackets resolve the tested 0.5 m³/h step. The airflow capacity and achievable adjustment precision of installed equipment remain unmeasured.
OUTLET TRANSFER / TWO DIRECTIONS
Both rooms were simulated with the selected ceiling outlet at 540.54 m³/h. Each of the five other outlets began at 200.772 m³/h. Outlet 4 was one of those five other outlets. It received exactly what outlet 3 or outlet 1 gave up. The selected outlet and the total of 1,544.4 m³/h stayed fixed.
A passing amount kept both destination seats at or below 90% of their own starting-seat exposure in the straight room (B′72) and the curved room (B72). C1 uses seat C1-N3. F1b uses the highest ratio across 41 placements of seat F1b-N1. Each row gives the worst ratio over both rooms, both heights and all tested airflow conditions for one way of reading the field.
| Air transfer | Readout | Last pass (m³/h) | First fail (m³/h) | At last pass | At first fail | First limit crossed |
|---|---|---|---|---|---|---|
| 3 → 4 | Nearest cell | 15.5 | 16.0 | 89.99921% | 90.00123% | B72 / C1-N3 |
| 3 → 4 | Interpolated | 99.5 | 100.0 | 89.99980% | 90.00196% | B72 / C1-N3 |
| 1 → 4 | Nearest cell | 32.5 | 33.0 | 89.99939% | 90.00035% | B72 / C1-N3 |
| 1 → 4 | Interpolated | 195.5 | 196.0 | 89.99936% | 90.00062% | B72 / C1-N3 |
Each cell gives either the last pass / first failure in m³/h or the endpoint at zero donor flow, using the same 16-condition check in that room. The common limits above use the room that crosses 90% first. A donor can give up at most its initial 200.772 m³/h.
| Air transfer | Readout | Straight room (B′72) | Curved room (B72) |
|---|---|---|---|
| 3 → 4 | Nearest cell | 24.5 / 25.0 | 15.5 / 16.0 |
| 3 → 4 | Interpolated | 100.5 / 101.0 | 99.5 / 100.0 |
| 1 → 4 | Nearest cell | 51.5 / 52.0 | 32.5 / 33.0 |
| 1 → 4 | Interpolated | Donor empty at 200.772 (no failure) | 195.5 / 196.0 |
At every room-specific last pass, all 153 C1 and 37 F1b gains held. Where the table lists a first failure, that room lost the 153 C1 gains and kept all 37 F1b gains under the reading named in that row. In the straight room the interpolated 1 → 4 transfer reached zero remaining donor flow with both groups still qualifying.
We replayed the full seat menus for 7,490 simulated cases per starting table in each room, preserving individual preferences, travel limits and starting poses. The equal-sharing reference had 153 previously gained C1 cases and 37 previously gained F1b cases per room. At each last pass, those same cases kept a seat in both rooms. This table counts how many still qualified at the first failure for that readout. Within each cell the straight room is listed first, followed by the curved room.
| Air transfer | Readout | First fail (m³/h) | C1 kept (B′72 / B72) | F1b kept (B′72 / B72) |
|---|---|---|---|---|
| 3 → 4 | Nearest cell | 16.0 | 153 / 0 | 37 / 37 |
| 3 → 4 | Interpolated | 100.0 | 153 / 0 | 37 / 37 |
| 1 → 4 | Nearest cell | 33.0 | 153 / 0 | 37 / 37 |
| 1 → 4 | Interpolated | 196.0 | 153 / 0 | 37 / 37 |
For 3 → 4 at 16.0 m³/h, the curved room kept 0 of its earlier C1 gains with the nearest-cell reading and 153 with the interpolated reading. For 1 → 4 at 33.0 m³/h, the curved room kept 0 of its earlier C1 gains with the nearest-cell reading and 153 with the interpolated reading. At these four boundaries, no case outside the earlier gains lost a qualifying seat and no case newly qualified under the readout defining that boundary. At each first failure, changing only the limiting destination’s exposure reproduced the complete case change in its room. Restoring only that seat’s exposure restored the original case outcomes. The readout matters because a seat close to 90% can change classification when sampled at a cell centre or between centres. The geometry and verified return routes are the ones in the chair placement study.
At the last tested interpolated pass for each direction, the interpolated reading retained 153 C1 cases and 37 F1b cases in each room. At the exact same flows, the nearest-cell reading gave the counts below. This table counts the earlier gains. The paragraph below also counts other cases that lost eligibility.
| Direction | Transfer (m³/h) | Room | C1 kept of 153 | F1b kept of 37 |
|---|---|---|---|---|
| 3 → 4 | 99.5 | straight | 0 | 37 |
| 3 → 4 | 99.5 | curved | 0 | 37 |
| 1 → 4 | 195.5 | straight | 0 | 0 at 1 position, 37 at 40 |
| 1 → 4 | 195.5 | curved | 0 | 0 at 1 position, 37 at 40 |
At 195.5 m³/h from outlet 1, F1b failed the all-position test under the nearest-cell reading. That reading left the 37 earlier F1b cases without a suitable seat at exactly one of the 41 chair positions in each room, 40 mm back and 40 mm left. At that corner, six additional cases also lost a qualifying seat, making 43 F1b losses among the 7,490 cases per room. The other 40 positions kept all 37 earlier gains. The interpolated reading kept all 37 at every position.
The first screen used the model condition with stronger mixing of the tracer between cells. It tested 0, 12.87, 25, 50, 75, 100, 150 and 200.772 m³/h, up to the donor’s full starting flow. We narrowed each crossing to adjacent 0.5 m³/h settings, then checked both ends of each bracket over 16 grid and airflow combinations per room. The 250 and 100 mm horizontal grids each had six conditions, the 125 mm grid had two, and the 83.33 and 62.5 mm grids each had one high-mixing condition. Each field was read at 0.55 and 1.65 m, taking the ratio at the destination and starting seat within the same field.
A ratio at or below 90% passed, using unrounded values. The nearest-cell reading used one horizontal cell centre. The interpolated (bilinear) reading used the four surrounding centres at the same height. Each newly solved field met a periodic closure tolerance of one part in 100 million. Recomputed reference readings agreed with the archived samples to within one part in a million. Repeating the governing readings with a one-second time step instead of two changed them by at most 0.00022 percentage points. At the narrow 3 → 4 interpolated last pass (99.5 m³/h), the ratio went from 89.99980% at 2 s to 89.99958% at 1 s. All repeated readings stayed on the same side of 90%. The intervals describe these numerical tests. Actual outlet capacity and balancing tolerance would require separate measurements.
FIVE STUDIES / CEILING AIR AND SEAT CHOICE
The equal-share edge was 522.52 m³/h. At the working setting of 540.54 m³/h, people starting at both tables could still choose a suitable seat in the straight room (B′72) and the curved room (B72). Each boost below is relative to one outlet’s nominal 257.4 m³/h. Each exposure percentage compares a destination with its own starting seat under the same airflow condition. A seat meets the lower-exposure rule at 90% or less.
We tested boosts of 0%, +75% and +90% to +125% in five-point steps. Whatever the selected outlet gave up was split evenly between the other five. At +125% each of those five received 193.05 m³/h. At +110% each received 200.77 m³/h before any transfer. Across two rooms, two sample heights and both ways of reading the air field, C1 passed at +105% and failed at +100%. The destination seat for the F1b table stayed within the limit at both settings.
We checked whole percentage points inside the bracket, then quarter points. At +102.75% the largest C1 ratio was 90.0012%. At +103% it was 89.9990%. The limiting reading was at the C1 destination in the curved room, using the nearest cell. The two outlet flows differ by 0.64 m³/h. Repeating the calculation with a 1 s time step instead of 2 s gave the same pass/fail decisions. The largest shift was 0.00073 percentage points.
We tested the adjacent settings and +110% on the full set of 32 room and airflow combinations. Each setting included six conditions on each of the 250 and 100 mm horizontal grids, two on the 125 mm grid and one high-mixing condition on each of the 83.33 and 62.5 mm grids. That makes 16 combinations per room. Within each combination, we sampled at 0.55 and 1.65 m using the nearest cell and an interpolated value from four surrounding cell centres. The table takes the highest ratio over both rooms, heights and readings. C1 uses one destination, C1-N3. F1b uses 41 positions of its destination chair, F1b-N1.
| Boost above nominal | Outlet (m³/h) | C1-N3 maximum | F1b-N1 maximum | Passes in both rooms? |
|---|---|---|---|---|
| +102.75% | 521.88 | 90.0012% | 89.9505% | No (curved room, nearest cell) |
| +103% | 522.52 | 89.9990% | 89.9504% | Yes |
| +110% | 540.54 | 89.9368% | 89.9476% | Yes |
| +125% | 579.15 | 89.8036% | 89.9417% | Yes |
At the binding equal-share edge, modelled dose at the C1 destination changed by +0.283% relative to +125%. The dose at its starting seat changed by +0.065% under the same condition. The reference and new ratios use their respective starting doses.
We numbered the five other outlets 1–5. At +110% and +125%, we moved 12.87 m³/h from one other outlet to another, holding the selected outlet and zone total fixed. All 20 directed pairs were screened in both rooms under high mixing, first at 250 mm and then also at 125 mm. For each setting we took the pair with the highest ratio across the two screening grids and ran the full 32-combination check. We also ran that check on the pairs selected by the original 250 mm screen. The other pairs were checked on the screening grids.
| Outlet boost | Screen passes | Receiver ← donor | C1-N3 maximum | F1b-N1 maximum |
|---|---|---|---|---|
| +110% | 20 / 20 | 4 ← 3 | 89.9886% | 89.9504% |
| +125% | 20 / 20 | 4 ← 1 | 89.8283% | 89.9481% |
At +110%, the 250 mm screen selected 4 ← 3 and the two-grid screen selected 4 ← 3. At +125%, the 250 mm screen selected 4 ← 3 and the two-grid screen selected 4 ← 1. For the +110% setting the full check moved air from outlet 3 at (16.5 m, 5.0 m) to outlet 4 at (13.5 m, 7.3 m) in room-plan coordinates.
We replayed the same 7,490 simulated cases per starting table per room at all 41 chair positions, with the same preferences, travel limits, body profiles and start poses, both occupancy settings and the established reading rules. The table counts previously gained cases that kept a suitable seat. C1 had 153 and F1b had 37 in each room at the +125% reference. The straight room (B′72) is listed first, followed by the curved room (B72).
| Setting | Seat readout | C1 kept, B′72 / B72 | F1b kept, B′72 / B72 |
|---|---|---|---|
| Just below edge (+102.75%, 521.88 m³/h) | Nearest cell | 153 / 0 | 37 / 37 |
| Just below edge (+102.75%, 521.88 m³/h) | Interpolated | 153 / 153 | 37 / 37 |
| Edge, equal (+103%, 522.52 m³/h) | Nearest cell | 153 / 153 | 37 / 37 |
| Edge, equal (+103%, 522.52 m³/h) | Interpolated | 153 / 153 | 37 / 37 |
| Working, equal (+110%, 540.54 m³/h) | Nearest cell | 153 / 153 | 37 / 37 |
| Working, equal (+110%, 540.54 m³/h) | Interpolated | 153 / 153 | 37 / 37 |
| Working, uneven (+110%, 540.54 m³/h) | Nearest cell | 153 / 153 | 37 / 37 |
| Working, uneven (+110%, 540.54 m³/h) | Interpolated | 153 / 153 | 37 / 37 |
| Reference, uneven (+125%, 579.15 m³/h) | Nearest cell | 153 / 153 | 37 / 37 |
| Reference, uneven (+125%, 579.15 m³/h) | Interpolated | 153 / 153 | 37 / 37 |
Just below the edge, nearest-cell readings left 0 of the 153 C1 cases with their earlier option in both rooms, 153 in the straight room alone, 0 in the curved room alone and 0 in neither room. All 37 earlier F1b cases kept a suitable seat in both rooms. Among all 7,490 C1 cases per room, the straight and curved rooms lost 0 and 153 previously qualifying cases respectively. Of these, 0 and 0 were outside the 153 original gains. Newly qualifying cases numbered 0 and 0. Changing only C1-N3 to its lower-setting exposure reproduced all 153 curved-room losses. Restoring only C1-N3 to its +125% exposure restored all those cases.
The conclusions cover seated exposure and seat choice at the tested settings. The verified sightlines and return routes use the same 72-seat geometry throughout. Installed airflow tolerances and fan energy remain unmeasured.
SEATED EXPOSURE / GRID SENSITIVITY
All 41 positions passed in both rooms. At the F1b starting table, a group member’s chair (S1) stayed 103 mm along the row from its original position, away from the next chair. The other chair (N1) was the lower-exposure destination. Sliding N1 40 mm back and 40 mm left of its own mark brought it closest to the 90% limit. The highest interpolated ratio at that corner rounded to 89.85% in each room.
In the earlier study, the nearest air cell gave 89.92% at the corner in the straight room and 89.94% in the curved room. On the three new grids alone, the largest nearest-cell value rounded to 89.84% in each room. The original 125 mm grid still gave the highest nearest-cell values overall.
We also read the same fields at each chair’s coordinates by interpolating between four cell centres in the floor plan. Each grid uses the same vertical layers. The two samples lie at layer centres 0.55 and 1.65 m high. This test varied horizontal resolution only. For each height and condition, we divided seated dose at the destination by dose at the starting seat before taking the maximum.
The table shows the highest interpolated ratio at the back-left position on each grid. The original 250 mm grid covered six airflow conditions and the 125 mm grid covered default and high mixing. We solved all six again at 100 mm. At 83.33 and 62.5 mm we repeated the high-mixing condition that governed the previous result.
| Horizontal grid spacing | Conditions | Straight / B′72 | Curved / B72 |
|---|---|---|---|
| 250 mm | 6 | 89.79% | 89.83% |
| 125 mm | 2 | 89.83% | 89.85% |
| 100 mm | 6 | 89.82% | 89.84% |
| 83.33 mm | High mixing | 89.82% | 89.83% |
| 62.5 mm | High mixing | 89.85% | 89.85% |
Under high mixing at 0.55 m, the curved room reached 89.848% on the 125 mm grid and 89.851% on the 62.5 mm grid. The smallest interpolated margin was 0.15 percentage points. Nearest-cell sampling left 0.08 percentage points in the straight room and 0.06 in the curved room. The estimates rise and fall with horizontal spacing. Convergence to a single model value remains open, as do physical exposure and installation tolerance.
We replayed the same 7,490 simulated cases per starting table per room at every position, using both sampling methods. At F1b, 37 cases in B′72 and the same 37 in B72 kept their earlier gain. At the separate C1 table, 153 in B′72 and the same 153 in B72 kept the gain from the air-supply change at seat C1-N3. The case identities matched across rooms. C1 has a separate set of seats, so its exposure comparison depends on how its own starting seat and candidates are sampled. Across the full seat menus, no case gained or lost eligibility relative to the previous study.
All 32 airflow runs used the same source, air supply, door schedules for each condition and 20-minute cycle. Every run met the periodic closure tolerance of one part per million. The largest relative mass-balance residual was below 5 × 10⁻¹². The chair centres, sightlines, individual movement limits and the ten other verified return routes came from the chair movement study. This test changes the airflow estimate at those positions.
CHAIR POSITION / MATCHED SIMULATION
All 41 tested positions passed in both rooms. In each room, 37 of 7,490 F1b cases kept the option they had gained when the N1 sightline and approach changed. Separately, 153 of 7,490 C1 cases kept the option they had gained at C1-N3 when its air supply changed. The identities matched across rooms at each starting table. No previously qualifying case lost its choice, and no new case qualified relative to the centred chair.
The values below are the destination chair’s seated exposure as a percentage of the F1b starting seat’s exposure. Lower is better. Each value is the highest ratio across eight airflow conditions and two sampling heights.
| Chair centre | Straight / B′72 | Curved / B72 |
|---|---|---|
| On the mark | 89.41% | 89.44% |
| 40 mm back + 40 mm left | 89.92% | 89.94% |
The closest margin was 0.06 percentage points in the curved room. The model samples the nearest air cell on 125 or 250 mm grids. Several chair positions therefore return the same exposure. This is a simulated comparison at the seat, not a measurement of millimetre-scale airflow or of the dose while walking.
At every position, the person at N1 and the same two group members (S1 and S6) could see one another in both directions. The group kept its shared board views. The neutral round trip ranged from 14.08 to 14.25 m (14.16 m on the mark). All 328 destination journeys (41 positions × 2 rooms × 2 occupancy conditions × 2 body profiles) finished with the person back at the start and both chairs restored to their respective presets.
We checked all 10 other routes in the existing C1 and F1b menus, wherever they had been available. None closed. A further 48 marked-start trips checked four N1 placements (the centre and three diagonals) and two other routes (C1-N3 and F1b-N2) at outer corners, each under the same eight room, occupancy and body combinations. This does not establish access from every seat in the room.
Only the F1b-N1 chair centre moved. Forward and right follow the seated person’s facing. Its 95° turn, the S1 chair at 103 mm with its 75° clockwise turn, the other furniture and the walking waypoints stayed fixed. The grip, pull and seated body moved with N1. We tested 25 positions on a 10 mm grid through ±20 mm on each axis, eight extra axial or diagonal positions at 5 mm, and eight at 40 mm. Blank space on the map was not tested.
We reused 7,490 simulated cases per starting table. Each case already had an assigned body profile, starting pose, preferences and travel limit. We evaluated those same cases in each room, under each occupancy condition and both reading-error models. Repeated runs do not increase the case count. The 37 and 153 are retained gains from earlier studies, reported separately by starting table. The simulation does not establish an installation tolerance or human comfort.
S1 CHAIR MARKS / PAIRED SIMULATION
The 103 mm mark preserved the full choice of seats at all 128 separately sampled fractional errors. The 100 mm mark did so at 105. The 23 differences were seated contacts with the next chair at the 100 mm mark. Both layouts gave the same result. A passing setup retained every original case outcome, including the earlier F1b and C1 gains, and kept all available routes open.
S1 is a chair at the original group table. Both marks measure from S1’s original centre along its row, away from its neighbour. At 97.7 and 108.1 mm, all 245 tested combinations of chair angles and cross-row positions passed. At 97.6 mm, some seated bodies touched the neighbouring chair. At 108.2 mm, some setups blocked trips to other seats.
| Mark | Toward neighbour | Away from neighbour | Smaller margin |
|---|---|---|---|
| 100 mm | 2.3 mm | 8.1 mm | 2.3 mm |
| 103 mm | 5.3 mm | 5.1 mm | 5.1 mm |
At 108.2 mm, 7 of 245 angle and cross-row combinations failed in each layout. Each closed the same five other F1b routes for both tested bodies. F1b-N1 kept its 37 gains, but the same 381 of 7,490 F1b cases lost their last suitable option in each failing setup. The earlier 120 mm test had closed those five routes for the same cases. C1 retained its earlier 153 gains at every physically usable setup tested. We did not assign case losses to a setup in which a seated body already intersected a chair.
| Paired error sets | Both pass | Only 100 mm | Only 103 mm | Both fail |
|---|---|---|---|---|
| Grid through ±5 mm | 4130 | 0 | 1015 | 0 |
| Separate fractional errors through ±5 mm | 105 | 0 | 23 | 0 |
| Wider grid through ±8 mm | 5278 | 322 | 1470 | 1015 |
Within ±5 mm, all 5,145 grid setups passed at the 103 mm mark, compared with 4,130 at 100 mm. This included all 16 extreme corner combinations at 103 mm and 8 at 100 mm. The wider grid includes the smaller grid. On its far side, 322 setups worked only at 100 mm. These counts describe a fixed catalogue of errors. Their frequency in an actual room has not been measured.
We applied the same along-row offset, cross-row offset and two independent chair-angle errors to both marks. For example, −4.5 mm gave an installed displacement of 95.5 mm at one mark and 98.5 mm at the other. B′72 and B72 used the same 7,490 simulated cases per starting location, both occupancy patterns, both broader body profiles, the same marked starts and both reading-error models. Case counts are reported once per starting location.
The main grid used along-row errors in 0.5 mm steps through ±8 mm, cross-row errors of −10, −5, 0, +5 and +10 mm, and independent angle errors of −2°, −1.5°, −0.5°, 0°, +0.5°, +1.5° and +2° on each chair. We sampled the two previously identified edges at 0.1 mm steps. The 103 mm candidate came from the prior whole-millimetre study. The 128 separate tuples were fixed before running this comparison, using a scrambled Sobol sample of offsets and S1 angles, with eight stratified fractional angles for the destination chair. F1b-N1 rotated about its fixed centre. Its position tolerance remains untested.
The test checked static fit, shared work-surface views, reciprocal sight, the full choice of return routes and each case’s movement budget. In the airflow model, both starting seats and F1b-N1 kept their previous exposure values. At every S1 position, the model sampled the same cell as at the 100 mm mark. The margins apply to the simulated configurations. Chair manufacturing variation, placement accuracy and movement as people sit or stand were outside the model. Whether that margin can be held in use remains untested.
Earlier whole-millimetre placement test · Chair plan and complete return
V31 / F1b-N1 / CHAIR PLACEMENT
At the F1b starting table, the revised layout had already given 37 more of 7,490 simulated cases a qualifying seat. S1 is the chair of a group member. This test moves S1 and checks whether the same cases keep their options in both rooms.
All 37 F1b gains hold at S1 positions from 98 to 108 mm. This distance is measured along the row from S1’s original position, away from S2. F1b-N1 rotates about a fixed centre. Every tested combination in that interval passed with both chair angles up to 2° off their marks and S1 at the centre or 10 mm to either side across the row. Both layouts kept all earlier qualifying cases, including the 153 gained at C1.
The reference setup turns F1b-N1 95° counterclockwise and S1 75° clockwise, with S1 shifted 100 mm away from S2. At 97 mm, 30 of 75 angle and cross-row combinations put the seated S1 occupant in contact with the neighbouring chair. At 109 mm, 15 of 75 combinations block another F1b route. All 75 combinations pass at each of the 11 whole-millimetre positions from 98 through 108 mm, giving 825 passing setups in this band.
With both angles on their marks, placing S1 120 mm from its original position still allows the F1b-N1 round trip at the centre cross-row position. All 37 F1b gains survive, but five other routes close and 381 previously qualifying cases lose their last suitable option. Checking the destination alone would miss that loss.
| What changes alone | Tested passing range | First failure tested |
|---|---|---|
| F1b-N1 chair angle | 4° clockwise to 5° counterclockwise (test edge) | 5° clockwise loses the view to S1 |
| S1 chair angle | 5° clockwise (test edge) to 2° counterclockwise | 3° counterclockwise loses the return view |
| S1 position along the row | 97–113 mm from the original chair position | 96 mm contacts S2’s chair. At 114 mm another route closes. |
| S1 position across the row | −10, 0 and +10 mm | All three passed at the nominal angles and 100 mm along the row. |
Angles are signed changes from the reference setup in plan. The first angle limits above use one-degree steps through ±5°. With the other marks centred, both one-angle failures in the table still allow a round trip, but the seat loses one reciprocal sightline and all 37 extra cases lose their qualifying option.
We applied identical setups and the same 7,490 simulated cases per starting location to B′72 and B72. The first pass combined both chair angles at one-degree steps through ±5° with S1 at 80, 90, 100, 110 or 120 mm along the row and at −10, 0 or +10 mm across it. Of 1,815 setups, 502 retained every qualifying case and route. We then tested 2,325 combinations in the smaller ±2° range at one-millimetre along-row steps. The two tests cover 3,840 distinct setups. These counts describe the chosen grid and do not estimate how often an installation error occurs.
Each setup was checked for seated clearance, views of the shared work surface, reciprocal views of group members and clearance along every available route for both broader body profiles. Qualifying cases were compared individually under both occupancy patterns and both reading-error models. The chair centres used to calculate exposure at F1b-N1 and at the start stay fixed. The worst destination-to-start exposure is 89.41% in B′72 and 89.44% in B72. S1 stays in the same exposure sampling cell as its 100 mm reference in every tested position.
The 98–108 mm interval applies to S1 at the sampled angles and positions. We tested rotation only at F1b-N1. Translating that chair would change its approach geometry and could change its exposure sampling cell. Its position tolerance is still open, as are intermediate angles and cross-row placements at S1. A 103 mm centre mark would place the tested edges 5 mm on either side. It is a candidate for a follow-up simulation at off-grid positions. The main animation shows the reference layout.
Original two-chair arrangement and chair plan (V30) · Earlier C1 supply test (V29)
V30 / F1b-N1 / PAIRED SEAT TEST
A new approach and two sightlines at F1b-N1 give 37 more cases a qualifying seat. A model comparison attributes 33 gains to the sightlines at the old travel distance. Four more cases qualify at the shorter distance. The verified round trip uses both changes. Both 72-seat layouts retain every previously qualifying case, including the 153 gained at C1 in the preceding supply test.
Before the activity, turn the empty F1b-N1 chair 95° counterclockwise in plan. Slide the group’s S1 chair 100 mm along its row away from S2 and turn it 75° clockwise. Both rooms use this preset. The destination chair now faces 57° from the centre of its own table, compared with 38° originally. The other 70 chairs and the shared work surface keep their positions. The plan above shows the tested preset. The main animation shows the reference layout.
In the original layout, all six lines between the destination and the three peers cleared the room geometry and other bodies. Their facing directions prevented two-way sight. Turning only F1b-N1 reached at most one peer. When S1 also turned, the neighbouring chair intersected the seated body on the fixed-centre and 50 mm placement screens. A 100 mm slide was the first tested offset that allowed the two-chair preset and a complete return.
Each angle is measured from straight ahead at 1.20 m seated eye height. The first angle looks from F1b-N1 to the peer. The second looks back. Both must be within 100° with a clear line of sight.
| Group peer | Original angles | Preset angles | Two-way view |
|---|---|---|---|
| S1 | 174.7° / 172.4° | 96.0° / 97.2° | Yes |
| S2 | 169.0° / 171.3° | 76.2° / 171.3° | No |
| S6 | 161.6° / 17.1° | 67.6° / 17.1° | Yes |
All four original group members see the five work-surface targets and one another before departure. After the move, the three remaining peers retain these views. S2 can be seen from the destination but cannot see back while keeping the whole work surface in view. At its fixed chair centre, even the best facing direction needs more than 106° to cover both. The tightest successful new link is S1’s return view, just 2.8° inside the model limit.
The original approach hit S1’s chair. The tested path shifts its middle waypoint 100 mm west, approaches a receiving point 350 mm farther north and 50 mm farther east, and uses the opposite grip and entry side. The chair pull stays at 300 mm. The neutral body trace for F1b-N1 falls from 14.52 to 14.16 m round trip. The marked-start traces measure 14.20 m.
All 84 available route, layout, occupancy and body-profile combinations completed a neutral round trip. All 32 additional journeys to F1b-N1 and C1-N3 completed the fixed-mark or corrected-mark start. The participant and the two chairs used in each journey returned to their preset positions. The 52 mm default mark, travel limits and two broader body profiles were held constant.
Each row uses the same 7,490 simulated cases at that starting location. Gains and losses compare each case with its own V29 result. Both layouts, both occupancy states and both reading-error models give the same 37 gains at F1b. The layouts reuse the cases, so their counts are reported once. The fractional unmet counts are expectations using an equal mix of the two reading-error models.
| Start | Previously unmet | Newly qualify | Lose access | Still unmet |
|---|---|---|---|---|
| C1 | 176.44 | 0 | 0 | 176.44 |
| F1b | 164.44 | 37 | 0 | 127.44 |
To separate the two effects, we recalculated eligibility twice. Pairing the new sightlines with the old distance gives 33 gains. Pairing the shorter distance with the original zero sightlines gives none. These two calculations isolate how the eligibility rule works. The original walking approach hits S1’s chair in the new layout. The tested combination of the new sightlines and the revised route gives the same 33 gains plus four more. No other offered seat changes its count of reciprocal links or its round-trip distance.
The earlier ceiling-supply setting stays in effect. Across the eight transport conditions and both sampling heights, the highest destination-to-start exposure at F1b-N1 is 89.41% in B′72 and 89.44% in B72, below the 90% limit. At S1’s shifted position, local exposure rises by up to 1.52% relative to its former position. The airflow model samples the existing field and does not resolve airflow around chairs or bodies.
The test establishes geometric visibility, clearance and simulated seat eligibility. It does not measure sustained viewing comfort, reach to the work surface or setup effort. The next simulation can vary chair placement and facing around this preset to find how much error the S1 link tolerates.
C1-N3 exposure and the 153 earlier gains (V29) · Which seats could meet more requests? (V27)
V29 / C1-N3 / MATCHED TRANSPORT AND SEAT TEST
C1-N3 meets the 90% exposure limit and gives 153 more cases a qualifying seat. In a follow-up to the initial 12 settings, increasing the nearest existing ceiling outlet from 257.40 to 579.15 m³/h brought the highest destination-to-start exposure ratio to 89.80% across the tested layouts, heights and conditions. The result is a modelled operating point with 0.20 percentage points of margin.
In the unmodified model the worst exposure ratios at C1-N3 were 90.99% in B′72 and 91.01% in B72. We first tested 12 settings under strong mixing, where the original ratios peaked. Four shifted extra flow to the nearest existing ceiling grille. Four diverted flow to a flush floor outlet behind the chair. Four supplied two new flush outlets on the east wall at different heights. The best floor and wall settings still gave 90.94% and 90.87% respectively at the governing layout and height.
Doubling the ceiling outlet flow passed in B′72 but reached 90.026% in B72, just above the 90% limit. After that screen we separately tested four larger ceiling increases. The smallest follow-up, +125% of the original outlet flow, passed. Five other outlets each give up 64.35 m³/h, transferring 321.75 m³/h to the selected outlet. Regional supply and extract totals stay fixed. Larger follow-up settings were screened under strong mixing only.
| Transport condition | B′72 · higher of two heights | B72 · higher of two heights |
|---|---|---|
| Default · 0.25 m | 63.69% | 63.79% |
| Low mixing | 20.47% | 20.53% |
| Strong mixing | 89.77% | 89.80% |
| Doors held open | 63.50% | 63.60% |
| Door pumping disabled | 63.99% | 64.09% |
| Wind | 63.82% | 63.92% |
| Default · 0.125 m | 62.82% | 62.80% |
| Strong mixing · 0.125 m (extra check) | 89.49% | 89.48% |
Each entry is the higher cycle-integrated tracer exposure at C1-N3 relative to the original C1 seat in the same run, across the 0.55 m and 1.65 m sampling heights. At the governing B72 low height in strong mixing, starting-seat exposure fell 0.37% and destination exposure fell 1.59%. The destination itself also stayed below 90% of the unmodified starting-seat exposure in every check.
| Start · 7,490 cases | Unmet before | Newly qualifying | Previously qualifying lost | Unmet after |
|---|---|---|---|---|
| C1 | 329.44 | 153 | 0 | 176.44 |
| F1b | 164.44 | 0 | 0 | 164.44 |
We applied the selected air distribution room-wide and recomputed every available seat’s exposure in both layouts and occupancy states. The comparison uses the established scent, visual-contact and movement-budget rule with the fixed lower-border reread. The same 153 C1 cases gained an option under every allowed readout error. Each gained through C1-N3. The seat now falls below the 90% minimum for requests to retain exposure. Every previously qualifying case with that request still had another suitable option. Giving each of the 436 source identities equal total weight gives a 2.10 percentage-point increase at C1. The original seven-case comparison and the additional fine-grid strong-mixing comparison gave the same case gains and losses. Fractional unmet counts are expectations across reading errors.
C1-N3 kept three reciprocal links to the original group. We checked 24 directed sightlines at seated eye height and replayed 16 complete trips across both layouts, body profiles and occupancy states. Body and both chairs returned to their starting positions. The representative round-trip body traces measured 17.81 m.
Across the 72 chairs, the largest exposure increase was 2.91% at the middle height of back-row seat B_Back_3_S3 in B′72 under low mixing. At most 2 chairs rose by more than 1% in any one layout, condition and height. At the most affected chair the normalized exposure integral went from 2.252 to 2.317 over the 20-minute cycle. Changes at the three original C1 group peers ranged from -6.11% to -0.27%.
The supply setting is 2.25 times the outlet’s original flow. The conservative transport model resolves three height bands, a repeating source pulse and a door schedule. Its tracer ratios are uncalibrated. Grille capacity, pressure drop, jet throw, noise and draught at this flow remain open engineering questions.
Earlier supply test at C1-OLD (V28) · Seat targets and remaining needs (V27)
V28 / C1-OLD / MATCHED TRANSPORT TEST
C1-OLD misses the 90% exposure target in all eight tested supply settings. Under strong mixing, the best ceiling setting reached 96.08% of starting-seat exposure at the governing height and layout. The local floor supply helped more at the lower height, but the middle height governed. The 270 potential gains identified for C1-OLD remain conditional.
In the ceiling trial, we moved clean supply from five outlets in the same zone to the existing ceiling outlet nearest C1-OLD. That outlet normally carries 257.4 m³/h. At full boost it carries 514.8 m³/h and each of the five donors carries 205.92 m³/h. After screening the ceiling settings, we tested a second design with a flush floor outlet 0.40 m behind the neutral chair. It receives part or all of the nearest ceiling outlet’s original flow through a modelled 0.30 m radius discharge area. Both designs retain the zone total of 1,544.4 m³/h and the original extract rates.
| Adjustment | Ceiling arm · target flow (m³/h) | Floor arm · floor flow (m³/h) | Ceiling B′72 | Ceiling B72 | Floor B′72 | Floor B72 |
|---|---|---|---|---|---|---|
| 0% | 257.40 | 0.00 | 96.16% | 96.18% | 96.16% | 96.18% |
| 25% | 321.75 | 64.35 | 96.12% | 96.14% | 96.19% | 96.20% |
| 50% | 386.10 | 128.70 | 96.10% | 96.12% | 96.21% | 96.23% |
| 75% | 450.45 | 193.05 | 96.08% | 96.10% | 96.24% | 96.25% |
| 100% | 514.80 | 257.40 | 96.05% | 96.08% | 96.26% | 96.28% |
Each ratio in the table is the higher of the two sampled heights for that layout in the strong-mixing case. At maximum flow, 0.55 m governed the ceiling result and 1.65 m governed the floor result. We also ran the default condition at full adjustment. Its governing ratio across layouts was 85.70% for the ceiling and 86.33% for the floor, compared with 86.21% before adjustment. Qualification requires 90% or less in all seven original transport cases, at both heights and in both layouts. Each of the eight settings failed one required case, so the remaining five cases were unnecessary for this rejection.
| Full setting · high mixing · 1.65 m | Starting-seat AUC (change) | C1-OLD AUC (change) |
|---|---|---|
| Ceiling / B′72 | 372.81 (-0.46%) | 357.34 (-0.78%) |
| Ceiling / B72 | 372.76 (-0.45%) | 357.35 (-0.78%) |
| Floor / B′72 | 373.15 (-0.37%) | 359.21 (-0.26%) |
| Floor / B72 | 373.08 (-0.37%) | 359.19 (-0.26%) |
AUC integrates the normalized tracer concentration over the model’s repeating 20-minute cycle. Changes in parentheses compare the same seat and height with the corresponding unmodified run. At full floor supply the middle-height destination AUC fell slightly, but the starting-seat AUC fell more, raising their ratio. Across both full settings, layouts and heights under strong mixing, absolute changes at the three original group peers ranged from -0.51% to -0.24%. Across all 72 chairs the range was -2.68% to +0.64%. Under default mixing, the largest increase at an individual chair was +3.06%.
At seated eye height, C1-OLD kept all three reciprocal links to the original group in B′72 and B72, with basic occupancy and with five extra people. We checked 24 directed rays and replayed 16 representative complete journeys covering both broader body profiles and both occupancy states, including corrected and fixed-foot starts. The body and both chairs returned to their starting states. The floor design assumes a level grille with no above-floor obstruction.
The tracer experiment uses the archived connected three-layer transport model, a 0.25 m horizontal grid and a conservative periodic solve with the original source pulse and door schedule. The strong-mixing coefficient was 0.5 m²/s and the default was 0.1 m²/s. The field has no resolved diffuser jets, furniture drag, body plumes or calibrated odour measurements. Real outlet capacities, underfloor feed and occupied-floor airflow have yet to be established. No new qualifying cases are credited to C1-OLD under these settings. The next candidate already identified at C1 is C1-N3, near the threshold in the unmodified model.
V27 / REMAINING SEAT NEEDS / PAIRED SIMULATION
A lower-exposure option at C1-OLD would help 270 cases. Three visual links at F1b-N1 would help 54. These are separate design targets for existing destinations. Each count is the number of previously unmet virtual cases that would gain a qualifying option if the target were achieved within the existing movement budget.
We used the lower-border reread rule for the same 7,490 cases at each origin. The 2,912 cases requesting at least 10% lower exposure accounted for all remaining misses. Counting each virtual case once within that group, 11.3% lacked a qualifying option at C1 and 5.6% at F1b. Cases with a retention request or no scent threshold already had at least one qualifying option. Staying in the original seat counted if it met the request.
| Why no option qualifies | C1 cases | F1b cases |
|---|---|---|
| Departure blocked, suitable destination already within budget | 51.44 | 54.44 |
| Departure blocked, destination conditions also unmet | 5.00 | 2.00 |
| Departure open, all scent- and contact-matching destinations over budget | 273.00 | 108.00 |
| Departure open, no destination matches scent and contact together | 0.00 | 0.00 |
| Total unmet | 329.44 | 164.44 |
At both origins, each of the open-departure cases in the over-budget row had an existing destination that matched its requested exposure and visual contact. It could not afford the verified return trip to any such destination. All 273 of these C1 cases and 108 F1b cases are included in the totals above.
| Change at one destination | Additional qualifying cases | Unmet after that one change |
|---|---|---|
| C1-OLD · offer 90% of starting exposure | 270 | 59.44 |
| C1-N3 · offer 90% of starting exposure | 153 | 176.44 |
| F1b-N1 · two visual links | 33 | 131.44 |
| F1b-N1 · three visual links | 54 | 110.44 |
C1-OLD. This nearby seat already has three visual links to the original group. Its simulated exposure is 96.16% of starting exposure in B′72 and 96.18% in B72. An optional mode at or below 90% would serve 270 of the 273 open-departure cases. A different target at C1-N3 would serve 153 of those same cases. The next spatial test is whether a local exposure change can reach the target at C1-OLD while preserving its three sightlines and the verified trip. Exactly 90% meets the simulated threshold with no margin.
F1b-N1. This seat is already below the 90% exposure limit in both layouts. Its current model has zero visual links to the original group. Two links would meet the needs of 33 additional cases. A third would bring in another 21. The spatial test here is to obtain the required sightlines at this seat while preserving its lower exposure and the existing trip.
We ranked each single-seat target by its lowest expected gain across both layouts, occupancies and error patterns. For example, lowering exposure at C1-N4 could help 77 cases at basic occupancy, but that seat is occupied in the five-extra-occupant scenario. Each target preserves all previously qualifying options in the model. Counting each case only once across all screened alternatives, 270 cases at C1 and 54 at F1b could gain an option. The leading target at each origin covered that entire set. Cases still over budget or unable to depart remain in the residual.
The two quarter-carryover scenarios from V26 received equal weight. Fractional counts are expectations over readout errors. The same 270 and 54 cases gained in every allowed error pair, in both layouts, with basic occupancy and with five extra occupants. We screened the available destinations with validated return routes, kept each case’s accurately stated scent preference, contact requirement and movement limit, and credited a gain only when one seat met all three. Achieving the proposed exposure or sightlines still needs a transport or visibility simulation.
V26 / COST OF A PILOT LOG / PAIRED SIMULATION
A 214-entry pilot first pays off at 2,862 eligible encounters when recording 20 entries costs as much as one extra reading. This assumes equal chances of two simulated error patterns and allows the pilot to cancel foot corrections as it runs.
An eligible encounter is a first reading in the lower border, where the two policies differ. The full run includes the pilot. On the same panel of 7,490 virtual cases per origin, only 214.19 first readings qualify on average. At that rate, 2,862 eligible encounters correspond to about 100,000 simulated first readings.
Start by rereading the first 214 eligible encounters. Each extra reading costs one unit. Whenever it cancels a planned 2 mm correction, it saves four units. Recording the observation adds a separate charge. At 0.05 units per entry, the 214 records cost 10.70 units. After the pilot, reread future lower-border encounters if at least 54 corrections were cancelled. Otherwise read once. End research logging when the pilot ends.
In each run, position and toe-angle errors each carry over with 25% probability. The two patterns differ in when this happens. In one, the carryovers are independent. In the other, they always occur together. Each run keeps its pattern throughout. Giving the two patterns equal weight makes fixed rereading cheaper on average than fixed single reading.
| Extra effort to record one entry¹ | First total at which a 214-entry pilot is cheaper |
|---|---|
| 0 | 215 |
| 0.01 | 744 |
| 0.05 | 2,862 |
| 0.1 | 5,510 |
| 1 | 53,167 |
¹ Recording effort is expressed in extra-read units. The table gives the first whole encounter count with strictly lower expected burden than both fixed rules. For the 0.05 assumption that leaves 2,648 encounters after the pilot to recover the cost of keeping the log.
Each plan below uses the same recording charge of 0.05 units per pilot entry and an equal chance of either error pattern.
| Eligible encounters | Lowest expected burden tested | Saved vs reading once | Saved vs fixed rereading |
|---|---|---|---|
| 214 | Reread from the start | 1.30 | 0.00 |
| 1,000 | Reread from the start | 6.08 | 0.00 |
| 5,000 | Log 214, then choose | 39.05 | 8.64 |
| 20,000 | Log 2,000, then choose | 286.70 | 165.06 |
At 1,000 encounters the 214-entry pilot costs 1.44 units more than reading once and 7.52 more than fixed rereading. At 5,000 it saves 39.05 and 8.64 units, respectively. These are expected totals for the whole run. The menu compares both fixed policies with pilots of 25, 50, 100, 214, 500, 1,000, 2,000, 5,000, 10,000 or 20,000 eligible encounters, up to the run length.
We tested two ways to choose after the log. The plans above use rereading if more than one in four corrections was cancelled. The stricter V25 rule uses a single reading whenever the evidence is inconclusive. With a 214-entry pilot, that stricter rule requires 67 cancellations to continue rereading. At 5,000 encounters it costs 33.35 units more than fixed rereading in the equal-weight comparison.
At 5,000 encounters, if only one in four runs has independent carryover, reading once throughout is the cheapest tested plan. If three in four have independent carryover, rereading throughout is cheapest. Comparing the two fixed rules alone, rereading costs less when independent carryover accounts for more than 43.42% of runs. The scenario weights and recording charge are study assumptions.
Another way to choose is to limit the largest expected excess cost in either of the two patterns. At 5,000 encounters and 0.05 units per record, the best tested pilot on that criterion also logs 214 repeats. Its largest excess cost is 94.72 units relative to knowing the correct fixed policy in advance, compared with 200.61 for the better of the two fixed rules judged on this criterion.
C1 and F1b used the same matched users and starting poses in B′72 and B72 under both occupancies. The burden results agree across all eight comparisons. Both candidate reading policies preserved a qualifying option for every previously qualifying case on the original 7,490-case panel. Their minimum gains over the fixed 52 mm mark were 53 at C1 and 56 at F1b. The comparison prices reading, completed corrections and recordkeeping after those seat requirements are met.
V25 / FINITE REREAD LOGS / PAIRED SIMULATION
214 rereads seldom settle a close decision. With a 25% carryover rate on each axis, choosing immediately picked the cheaper rule in 66.4% of simulated logs when carryover was independent and 63.9% when both errors carried over together.
Count how often a lower-border reread cancels a planned 2 mm correction. With one correction worth four extra readings, rereading pays off when more than one in four triggered repeats cancels a correction. A single reading costs less below that threshold. Both cost the same at exactly one in four.
If a choice is required immediately, choose rereading at 54 or more cancellations and one reading at 53 or fewer. To require stronger evidence, choose one reading at 40 or fewer and rereading at 67 or more. With 41–66, record the result as undecided. These cutoffs use a two-sided exact binomial test at a single planned look, with at most 2.5% in each tail at the tie.
| Reading errors | True cancellation rate | Wrong if forced | Undecided with evidence rule | Expected excess if forced¹ |
|---|---|---|---|---|
| Both drawn afresh | 32.00% | 1.3% | 38.9% | 0.77 |
| 25% each · never together | 27.08% | 24.9% | 90.2% | 4.43 |
| 25% each · independent | 26.31% | 33.6% | 93.6% | 3.76 |
| 25% each · always together | 24.00% | 36.1% | 95.3% | 3.10 |
| 30% each · independent | 24.98% | 49.3% | 96.0% | 0.06 |
¹ One unit is one extra reading. Excess is the average burden of applying the selected rule to a separate set of 7,490 cases at one origin, compared with knowing the cheaper rule. The calculation excludes the cost of collecting the decision log. In the two 25% independent and shared scenarios, a wrong decision costs 11.20 or 8.59 units, respectively. If undecided logs default to one reading, the average excess across all logs is 10.54 or 0.08 units, respectively.
| Reading errors | Immediate choice correct ≥90% | Evidence rule correct and decisive ≥90% |
|---|---|---|
| Both drawn afresh | 100 | 500 |
| 25% each · independent | 2,000 | 20,000 |
| 25% each · always together | 5,000 | 20,000 |
| 30% each · independent | Not reached by 20,000 | Not reached by 20,000 |
Each entry is the smallest tested fixed log meeting the target, from 25, 50, 100, 214, 500, 1,000, 2,000, 5,000, 10,000 and 20,000 repeats. The last column counts undecided logs against the target. Select a log size before starting. The cutoffs do not support repeated checks on a growing log.
Near the boundary, more certainty can buy very little. At independent 30% carryover on each axis, choosing the more expensive rule adds only 0.132 read units per 7,490 cases. At the exact cost tie, either choice has zero excess burden.
Each lower-border log contains triggered second readings of the stationary foot. The original model averages 214.19 such repeats for 7,490 first readings per origin. Longer logs sample independent virtual events with replacement from the same case and first-error distribution. We calculated the probabilities from the binomial count distribution and checked them against simulated logs. No counts from B′72 and B72 were pooled.
C1 and F1b had the same decision probabilities in both layouts and occupancies. In a separate panel under independent 25% carryover, a rule chosen from 214 repeats by immediate choice delivered 57.59 expected new qualifying cases at C1 and 60.59 at F1b. Either policy kept every previously qualifying case and at least 53 C1 and 56 F1b gains over the fixed 52 mm mark across the declared errors.
V24 / PAIRED READING ERRORS / SIMULATION
When both errors carry over independently at the same rate, the rules tie at 29.94% per axis. Below that rate, rereading the lower border costs less. Above it, reading once costs less. The decision can change when both errors tend to persist on the same repeat.
One completed 2 mm outward foot correction costs four extra readings. We used the same 7,490 virtual cases at each origin, C1 and F1b, in B′72 and B72. An error carries over when the repeat inherits that component of the first reading. Each component can also be drawn afresh and happen to match.
Choose the toe-angle rate in the first column. When the two carryover events are independent, rereading costs less below the corresponding position rate. Reading once costs less above it. For example, with a 50% angle rate, even a 20% position rate favours reading once.
| Toe-angle carryover | Foot-position carryover at equal cost |
|---|---|
| 0% | 53.91% |
| 25% | 33.14% |
| 50% | 19.06% |
| 75% | 8.88% |
| 100% | 1.18% |
In all three rows below, each component carries over on 25% of lower-border repeats. Only their overlap changes. The reread rule adds 214.19 readings on average per origin. The cheaper rule is the one that uses fewer burden points after counting both extra reads and corrections.
| How often the errors coincide | Both carried over | Cheaper rule · points saved | C1 gains with reread | F1b gains with reread |
|---|---|---|---|---|
| Never on the same repeat | 0% | Reread · 17.80 | 57.53 | 60.53 |
| Independent | 6.25% | Reread · 11.20 | 57.54 | 60.54 |
| Always on the same repeat | 25% | Read once · 8.59 | 57.58 | 60.58 |
At 25% each, position readings agree on 52.73% of repeats and angle readings on 53.03% in all three scenarios. But both displayed values agree on 27.97% of repeats with independent carryover and 35.37% with shared carryover. A simulation log must retain the two values from the same repeat to distinguish these patterns. These are expected agreement rates for a stationary foot under the specified error model.
Gains count cases newly meeting their scent preference, contact need and movement limit compared with the fixed 52 mm mark. Reading once gives 57.69 expected gains at C1 and 60.69 at F1b. Across all 81 allowed reading-error pairs, both policies kept a qualifying option for every case that already had one. The worst-case gains were at least 53 at C1 and 56 at F1b. The burden comparison gives no extra weight to gains beyond these floors. Results matched across layouts under basic occupancy and with five extra occupants.
Both policies correct when the first score is in [11.25, 16.75). The reread policy checks the stationary foot again in [11.25, 13) and cancels the correction if the new score leaves the wider band. On a fresh draw, position error is −1, 0 or +1 mm and toe-angle error is −0.25°, 0° or +0.25°, each with probabilities 25%, 50% and 25%. The probabilities of carrying over the two errors and their overlap are constant across cases and first readings. The earlier 21.87% tie applies when one event always carries both components over together.
V23 / POSITION AND TOE ANGLE / PAIRED SIMULATION
The result depends on which error repeats. If only foot-position error persists, reading once costs less above 53.91% carryover. If only toe-angle error persists, rereading the lower border costs less even at 100% carryover. These results hold at C1 and F1b in B′72 and B72 when a correction costs four extra readings.
Repeating the lower-border reading costs 214.19 extra reads per origin on average. To earn those back at a 4:1 burden ratio, the repeat must avoid more than 53.54688 corrections. With position error carried over every time, a fresh toe-angle reading avoids 40.73 corrections. With toe-angle error carried over every time, a fresh position reading still avoids 54.19. That clears the threshold by just 0.64 of an expected correction, or 2.56 read units across all 7,490 cases.
Expected counts per 7,490 paired virtual cases at each origin. Reading once gives 479.19 corrections and 57.69 newly qualifying cases at C1 or 60.69 at F1b. The gains in the table use the lower-border reread rule and the fixed 52 mm mark as the seat reference. The cost comparison prices extra readings and completed 2 mm outward corrections.
| Error carried over · rate | Corrections saved by rereading | Cheaper rule · points saved | C1 gains | F1b gains |
|---|---|---|---|---|
| Neither · 0% | 68.53 | Reread · 59.94 | 57.54 | 60.54 |
| Position · 50% | 54.63 | Reread · 4.34 | 57.52 | 60.52 |
| Position · 53.91% (tie) | 53.55 | Tie | 57.52 | 60.52 |
| Position · 100% | 40.73 | Read once · 51.25 | 57.50 | 60.50 |
| Toe angle · 50% | 61.36 | Reread · 31.25 | 57.54 | 60.54 |
| Toe angle · 100% | 54.19 | Reread · 2.56 | 57.53 | 60.53 |
Under every tested error pair, a case that already qualified at fixed 52 mm kept at least one qualifying option under both rules. Even giving each case its most adverse allowed pair, at least 53 cases at C1 and 56 at F1b newly met their scent preference, visual-contact need and original movement limit. Gains above those floors carry no extra weight in the burden calculation.
The rate is the modelled chance q that the selected error carries over on a triggered repeat. The other axis is drawn afresh every time. Both axes can independently land on the same displayed value by chance. Among repeats, even with fresh draws on both axes, the position readings agree 36.98% of the time. At the position-only cost tie, the displayed positions agree on 70.95% of repeats. This observable agreement and the 53.91% carryover probability describe the same tie under this error model.
The first score is inward position in millimetres plus three times the signed toe angle in degrees. Reading once triggers a correction in [11.25, 16.75). The other rule rereads only the lower border [11.25, 13), while the foot is stationary, and cancels the correction if the second score leaves the wider band. Position errors are −1, 0 or +1 mm and angle errors are −0.25°, 0° or +0.25°, each with probabilities 25%, 50% and 25%. The copy probability is independent of the case and first error.
We paired bodies, starting poses, preferences and first readings in both layouts, with basic occupancy and with five additional occupants. Eligibility matched case for case across layouts and occupancies at each origin. The expected number of corrections saved varies linearly between the 0% and 100% endpoints. The exact position-only tie is 959/1779, where we choose one reading for its fewer steps. The previous 21.87% tie applies when both errors carry over together. The costs and error laws are simulation assumptions.
V22 / REPEATED READING ERRORS / PAIRED SIMULATION
At a 4:1 correction cost, the switch comes at 21.87%. Below that chance of carrying the first error into a second reading, rereading the lower border costs less. Above it, reading once costs less. The switch was the same at C1 and F1b in both 72-seat layouts.
One extra reading costs one point. A completed 2 mm outward foot correction costs four. Both rules take the same first reading. They differ only when the first score reaches the lower border, where one rule corrects immediately and the other checks the stationary foot once more.
On each triggered repeat, the model either carries over the first position and toe-angle errors together or draws both errors afresh. The carryover chance is the same for every case and first error. Even with fresh draws throughout, both displayed values agree on 13.83% of lower-border repeats by chance. At the cost tie, the two readings therefore agree on 32.67% of triggered repeats. That percentage applies only to lower-border repeats with a stationary foot and the specified error model.
Expected counts per 7,490 matched cases at each origin. Reading once gives 479.19 corrections, 57.69 new qualifying cases at C1 and 60.69 at F1b. Rereading always adds 214.19 readings on average. Gains below are for the lower-border rule against the fixed 52 mm mark. The last column compares the two reading rules in extra-read units.
| Error carryover | Corrections with reread | C1 gains | F1b gains | Burden saved · by which rule |
|---|---|---|---|---|
| 0% | 410.66 | 57.54 | 60.54 | 59.94 · reread |
| 20% | 424.36 | 57.57 | 60.57 | 5.11 · reread |
| 21.87% (tie) | 425.64 | 57.57 | 60.57 | 0 · tie |
| 22% | 425.73 | 57.57 | 60.57 | 0.37 · read once |
| 25% | 427.79 | 57.58 | 60.58 | 8.59 · read once |
| 100% | 479.19 | 57.69 | 60.69 | 214.19 · read once |
With fresh errors throughout, rereading avoids 68.53125 corrections per origin. If q is the carryover probability, the burden saved by rereading is 4 × 68.53125 × (1 − q) − 214.1875. The exact tie is q = 959/4386. At the tie we choose one reading because it needs fewer steps. Equivalently, a second reading must cancel more than one correction in four repeats to reduce burden.
Across all 81 allowed error pairs, both rules kept every case that already qualified at fixed 52 mm. Even assigning each case its most adverse allowed errors, at least 53 cases at C1 and 56 at F1b newly met their scent preference, visual-contact need and movement limit. The fractional gains in the table are averages over errors. The cost comparison assigns no extra value to gains above those floors.
We reused the same 7,490 virtual cases drawn from 436 rating sources, with matched bodies, starting poses and first readings in B′72 and B72. We compared each origin separately at basic occupancy and with five additional occupants. Seat outcomes matched case for case across layouts and occupancies. Position errors of −1, 0 and +1 mm and toe-angle errors of −0.25°, 0° and +0.25° each have probabilities of 25%, 50% and 25%. The two axes are independent on a fresh draw. A different error distribution, partial carryover of just one axis or a different correction burden could move the switch. Both error persistence and the 4:1 cost are simulated assumptions.
V21 / BORDER CHOICE / PAIRED SIMULATION
The lower border pays off first. In 7,490 matched cases per origin, each rule gave at least 53 cases at C1 and 56 at F1b a newly qualifying seat, with zero losses versus fixed 52 mm. For independent errors, the lowest expected burden came from one reading below a correction-to-read burden ratio of 3.13, lower-only rereading between 3.13 and 7.99, and rereading both borders above 7.99. These approximate switches price readings and corrections after the seat test.
Keep 52 mm as the starting mark. The score is the inward ankle error in millimetres plus three times the toe-in angle in degrees, rounded to the nearest 0.25°. The lower border is [11.25, 13) and the upper border is [15, 16.75). A selected border gets one more reading of the stationary foot, then one outward 2 mm correction only if the second score falls in [11.25, 16.75). On any unselected part of that wide band, correct immediately. Outside it, keep the original pose. Each interval includes its lower endpoint and excludes its upper endpoint.
Each rule used the same 7,490 cases at each origin, including the same body, pose, preference and first reading. A qualifying seat meets the accurately stated scent preference, visual-contact need and original movement budget. Staying put can qualify. Across all 81 possible pairs of readings, we checked each case under its most adverse pair. All four rules preserved every previously qualifying case and retained the 53 and 56 minimum gains. B′72 and B72 matched case for case under basic occupancy and with five additional seated occupants.
Expected counts per origin when the two reading errors are independent. Each position error (−1, 0 or +1 mm) and toe-angle error (−0.25°, 0 or +0.25°) has probabilities 25%, 50%, 25% on its axis. A case receives one first reading. The extra-read column counts repeats only. An outward slide counts once, including if the case then stays.
| Rule | Extra reads | Corrections | C1 gained | C1 lost | F1b gained | F1b lost |
|---|---|---|---|---|---|---|
| Read once | 0.00 | 479.19 | 57.69 | 0.00 | 60.69 | 0.00 |
| Lower border only | 214.19 | 410.66 | 57.54 | 0.00 | 60.54 | 0.00 |
| Upper border only | 86.81 | 468.32 | 57.65 | 0.00 | 60.65 | 0.00 |
| Both borders | 301.00 | 399.79 | 57.50 | 0.00 | 60.50 | 0.00 |
Repeating only the lower border saved 68.53 corrections for 214.19 further readings. Adding the upper border saved another 10.86 corrections for 86.81 readings. The lower border accounts for 86.3% of the correction saving from re-reading both borders.
The borders filtered out different movements. Of the 68.53 corrections avoided at the lower border, 67.95 were for cases that could already complete the return. Of the 10.86 avoided at the upper border, 10.79 were for cases that would remain blocked after correcting. Both patterns matched across origins.
If the second reading repeats the first error exactly, the extra-read counts are unchanged, but every repeat confirms the first reading. All four rules then average 479.19 corrections, 57.69 C1 gains and 60.69 F1b gains, with no losses. One reading is cheapest for any positive read burden in this scenario.
Set one additional reading to one burden point. Let C be the burden of one correction in those points. Every rule already passed the seat-preservation gate. With no additional value on gains above that floor, the cheapest rule minimises extra readings plus C times completed corrections. Because the two first-reading borders are disjoint, the costs and benefits of adding them sum exactly. Upper-only is never the unique cheapest rule on this panel.
| Repeat error model | Seat value in read units | One read → lower only | Lower only → both |
|---|---|---|---|
| Independent | 0 | 3.1254 | 7.9914 |
| Half independent, half identical | 0 | 6.2508 | 15.9827 |
| Independent | 100 | 3.3420 | 8.3150 |
| Half independent, half identical | 100 | 6.4674 | 16.3064 |
Thresholds are rounded. At each exact threshold the two neighbouring rules tie. Prefer fewer readings on a tie. For example, if one correction costs four readings and the errors are independent, lower-only wins. If half the cases carry an identical error, one read wins at that same ratio. These burden values and error mixtures are assumptions.
To price the small difference in seat gains, let V be the value of one qualifying-seat gain in read units and p the assumed fraction with independent second errors. The rest repeat their first errors. For p > 0, add a border only when C exceeds (extra reads / p + V × gains forgone) / corrections saved. Compared with a single reading under independent error, the lower border forgoes 0.148 gains, the upper border 0.035, at each origin. These cases sought lower exposure. The gain forgone uses a different reference from a seat loss versus fixed 52 mm. Neither a human burden ratio nor a seat value was measured.
All rules share the same first and potential second readings. This pre-seeded independent-error run illustrates integer counts. The expected values above average all ordered error pairs.
| Rule | Extra reads | Corrections | C1 gained | C1 lost | F1b gained | F1b lost |
|---|---|---|---|---|---|---|
| Read once | 0 | 463 | 57 | 0 | 60 | 0 |
| Lower border only | 199 | 400 | 57 | 0 | 60 | 0 |
| Upper border only | 82 | 450 | 57 | 0 | 60 | 0 |
| Both borders | 281 | 387 | 57 | 0 | 60 | 0 |
Expected counts from the full V19 pose assignment, including the confirmation panel, under independent errors.
| Rule | Extra reads | Corrections | C1 gained | C1 lost | F1b gained | F1b lost |
|---|---|---|---|---|---|---|
| Read once | 0.00 | 2,017.75 | 252.00 | 0.00 | 268.06 | 0.00 |
| Lower border only | 943.81 | 1,733.79 | 250.94 | 0.00 | 267.09 | 0.00 |
| Upper border only | 320.75 | 1,980.60 | 251.86 | 0.00 | 267.89 | 0.00 |
| Both borders | 1,264.56 | 1,696.64 | 250.80 | 0.00 | 266.91 | 0.00 |
We reused the established two broader bodies, mirrored starts, checked return paths and the same 436 rating-source identities represented in confirmation. No rule was fitted to this comparison. A separate scalar calculation checked the seat conditions and enumerated the 81 reading pairs. All four rules reproduce the single-wide choices with identical error. The one-read and both-border controls also reproduce their archived V20 results. We replayed 32 representative confirmed gain trips, spanning both one-sided rules, layouts, origins, bodies and occupancies. Each restored the starting body and both chairs. The floor applies to the specified reading errors and simulated geometry.
V20 / BORDERLINE READING / MATCHED SEAT CHOICE
Read the borderline foot position twice. In 7,490 virtual cases per origin, the expected trade was 301 extra readings for 79.4 fewer corrections when the second reading had independent error. When it repeated the first error, the same extra readings avoided none. Both rules preserved all seats that already qualified at fixed 52 mm.
At the 52 mm starting mark, score the ankle’s inward position error in millimetres plus three times its toe-in angle in degrees, rounded to the nearest 0.25°. Both are positive toward the other foot. If the first score is in [13, 15), slide 2 mm outward. If it is in [11.25, 13) or [15, 16.75), read the stationary foot once more. Slide only if the second score is in [11.25, 16.75). Any other first reading keeps the original placement. Each interval includes its lower endpoint and excludes its upper endpoint.
The same virtual users, actual foot poses and first readings were paired in B′72 and B72 at both starts. In one scenario the second error was drawn independently and could match the first by chance. In the other, each person’s second reading repeated both components of their first error exactly. A single-reading comparison used the V19 wide band.
| Reading rule | Extra reads | Completed corrections | C1 gained | C1 lost | F1b gained | F1b lost |
|---|---|---|---|---|---|---|
| Single wide reading | 0.0 | 479.2 | 57.7 | 0.0 | 60.7 | 0.0 |
| Border repeat · independent error | 301.0 | 399.8 | 57.5 | 0.0 | 60.5 | 0.0 |
| Border repeat · identical error | 301.0 | 479.2 | 57.7 | 0.0 | 60.7 | 0.0 |
Entries are expected counts per origin. Every case receives one first reading. Each position error (−1, 0, +1 mm) and heading error (−0.25°, 0, +0.25°) had probabilities 25%, 50%, 25% on its axis. We summed all 81 ordered error pairs for independent readings. Identical readings use the nine matching pairs at their first-reading probabilities. These distributions are simulation assumptions.
With independent readings it took 3.8 extra reads per correction avoided. Compared with a single wide reading, the repeat gave up 0.18 potential seat gains on average at C1 and 0.18 at F1b. Neither origin lost a previously qualifying seat compared with fixed 52 mm. The relative effort of reading and sliding has not been measured.
| Reading rule | Extra reads | Completed corrections | C1 gained | C1 lost | F1b gained | F1b lost |
|---|---|---|---|---|---|---|
| Single wide reading | 0 | 463 | 57 | 0 | 60 | 0 |
| Border repeat · independent error | 281 | 387 | 57 | 0 | 60 | 0 |
| Border repeat · identical error | 281 | 463 | 57 | 0 | 60 | 0 |
| Border repeat · exact readings | 293 | 478 | 58 | 0 | 61 | 0 |
These are integer counts from one pre-seeded simulation, plus the exact-reading control. Both error scenarios reuse the same first observations for every case. With accurate or identically biased readings, the repeat confirms every borderline case, so it adds readings without changing any single-reading decision.
A correction is one completed outward 2 mm slide after the final decision, including for a case that then stays. Every requested slide in this panel cleared setup and the slide itself. Reading twice does not move the foot twice. The return trip reverses the slide to restore the original 52 mm pose. The table separates completing that slide from opening a complete route.
| Start | Reading rule | Corrections | Route opened | Route already open | Route still blocked | Passing route lost |
|---|---|---|---|---|---|---|
| C1 | Single wide reading | 479.2 | 180.9 | 206.7 | 91.6 | 0.0 |
| C1 | Independent repeat | 399.8 | 180.2 | 138.7 | 80.8 | 0.0 |
| F1b | Single wide reading | 479.2 | 181.9 | 206.7 | 90.6 | 0.0 |
| F1b | Independent repeat | 399.8 | 181.2 | 138.7 | 79.8 | 0.0 |
At each origin, 67.9 of the 79.4 avoided corrections were in cases that could already make the return before correcting their foot.
Seat gains and losses use the original fixed-52 rule as the reference. A seat must meet the case’s accurately stated scent preference, visual-contact need and movement budget. Staying at the original seat can qualify. Cases and seat transitions match across the two layouts, with basic occupancy and with five extra stationary occupants.
Even if each case experiences its own most adverse pair of the tested readings, at least 53 C1 cases and 56 F1b cases still gain a qualifying seat, with zero losses. The V19 band was widened by 1.75 score units on each side. Every true score in the old inner band therefore reads inside the wide band on both observations throughout this error set. This lower bound follows from that construction.
The larger descriptive replay includes the confirmation cases. Figures below are averages for the full V19 pose assignment, per origin.
| Reading rule | Extra reads | Completed corrections | C1 gained | C1 lost | F1b gained | F1b lost |
|---|---|---|---|---|---|---|
| Single wide reading | 0.0 | 2,017.8 | 252.0 | 0.0 | 268.1 | 0.0 |
| Border repeat · independent error | 1,264.6 | 1,696.6 | 250.8 | 0.0 | 266.9 | 0.0 |
| Border repeat · identical error | 1,264.6 | 2,017.8 | 252.0 | 0.0 | 268.1 | 0.0 |
This test reused the V19 confirmation poses and the same 436 represented rating-source identities. No new cue was fitted. An independent calculation checked the 81 reading pairs, original seat budgets, the bounds and the single-reading controls on both archived pose panels. We replayed 16 representative trips in which a second reading confirmed a borderline first reading and the case gained a suitable seat. All restored the original body and both chairs in the checked route geometry.
V19 / FOOT READOUT / PAIRED SIMULATION
A wider foot cue under reading error. In 7,490 held-out virtual cases per origin with newly assigned poses, at least 53 C1 cases and 56 F1b cases gained a qualifying seat across the tested ±1 mm and ±0.25° readings, with zero losses. The extra margin preserves the earlier cue’s exact-reading gains by design within this error range. With accurate readings, prompts rose from 185 to 478 at each origin.
Keep 52 mm as the default. Measure Y, the ankle’s inward error from the mark in millimetres, and A, toe-in from the prescribed heading in degrees rounded to the nearest 0.25°. Both point toward the other foot, mirrored on the opposite side. Slide the actual foot 2 mm outward if 11.25 ≤ Y + 3A < 16.75. Otherwise keep its current placement. The return restores the original pose.
A 1 mm position error and a 0.25° heading error in the same direction change the score by 1.75. Widening both ends by that amount keeps every pose the old rule would flag at an accurate reading inside the new band under the primary error test. For example, +7 mm inward and 2.25° toe-in gives 13.75. Reading both values low gives 12.00. The wider band prompts the correction in both cases.
Each rule is compared with keeping 52 mm. A case may stay put, or choose a seat with a verified return that meets its accurately reported scent preference, visual-contact requirement and movement budget. Each row applies separately to B′72 and B72, at basic occupancy and with five additional seated occupants. Gains and losses match for the same individuals across layouts and occupancies.
| Start | Cue | Gains with exact readings | Gains with one shared offset | Minimum gains with individual offsets | Maximum losses with individual offsets |
|---|---|---|---|---|---|
| C1 | Earlier band | 53 | 6–53 | 0 | 0 |
| C1 | Wider band | 58 | 54–58 | 53 | 0 |
| F1b | Earlier band | 56 | 6–56 | 0 | 0 |
| F1b | Wider band | 61 | 57–61 | 56 | 0 |
The shared-offset range gives all cases the same reading error. The next two columns allow a different, adverse reading for every case. Each position error is −1, 0 or +1 mm and each heading error is −0.25°, 0 or +0.25°. Only the reading changes. The actual foot, chair and destination route stay fixed.
With accurate readings, fixed 52 mm already qualified 7,103 C1 cases and 7,265 F1b cases. Shifting everyone gained 58 but lost 119 at C1, and gained 61 but lost 127 at F1b. Knowing in advance which departures would otherwise fail could recover at most 58 and 61, respectively.
| Start | Accurate readout | Prompted | Return opened | Already possible | Still blocked | Return lost |
|---|---|---|---|---|---|---|
| C1 | Earlier | 185 | 164 | 5 | 16 | 0 |
| C1 | Wider | 478 | 182 | 193 | 103 | 0 |
| F1b | Earlier | 185 | 165 | 5 | 15 | 0 |
| F1b | Wider | 478 | 183 | 193 | 102 | 0 |
A newly possible return counts as a seat gain only if a case previously missed a qualifying seat and can now select one. For both origins, the wider rule used 293 extra prompts to obtain five extra seat gains with accurate readings. Its larger benefit was preserving gains when the reading was wrong.
As a separate simulation, each reading axis was equally likely to err high or low (25% each) or to be exact (50%). The table shows exact mean counts over those assumed probabilities. In the independent model the two axes vary separately. In the same-direction model they have the same signed error step.
| Start | Cue | Mean gains, independent | Mean gains, same direction | Mean prompts, independent |
|---|---|---|---|---|
| C1 | Earlier | 37.5 | 30.0 | 178.2 |
| C1 | Wider | 57.7 | 56.8 | 479.2 |
| F1b | Earlier | 39.5 | 31.5 | 178.2 |
| F1b | Wider | 60.7 | 59.8 | 479.2 |
Doubling the error range to ±2 mm and ±0.5° gave 6–58 C1 gains and 6–61 F1b gains under a common bias with the wider rule. When the adverse reading could differ for each case, the minimum fell to zero at each origin. No previously qualifying case lost its seat across the 25 tested offsets. These models assign reading errors by assumption. Actual measurement precision and the effort of unnecessary foot prompts remain unmeasured.
| Start | Panel | Exact gains, earlier → wider | Adverse individual minimum, earlier → wider | Wider band losses, maximum |
|---|---|---|---|---|
| C1 | Previously reported confirmation (7,653) | 46 → 56 | 0 → 46 | 0 |
| F1b | Previously reported confirmation (7,653) | 54 → 63 | 0 → 54 | 0 |
| C1 | Whole original panel (30,000) | 239 → 283 | 0 → 239 | 0 |
| F1b | Whole original panel (30,000) | 254 → 299 | 0 → 254 | 0 |
We kept the V18 score and used its original 7,411 calibration cases to compare 227 candidate choices, including the earlier band and no shift. We excluded any band that could prompt contact at setup or during the slide, or lose an existing return, under a primary reading error on calibration. Among the others we maximised a conservative geometry F1 score that rewards departures recovered under every reading and penalises unnecessary prompts that could occur under any reading. Exact ties went to fewer prompts at zero error, then a narrower interval, then catalogue order.
The band was locked before assigning fresh body, side, foot-position and heading draws to the same 30,000 virtual preference records. The main comparison uses 7,490 rows from 436 reserved rating-source identities on reserved pose tiles. All 436 source identities represented here were also in the V18 confirmation sample. Only the pose assignments are new. The previously studied geometry and earlier confirmation results motivated this test. The whole-panel replay includes calibration cases. No additional user response was collected.
An independent calculation reproduced seat transitions and all bias scenarios for both layouts and occupancies. The full-grid audit covered 69,938 pose and mirror combinations per origin. With the primary offsets no cue-induced setup or slide contact or previously passing return loss occurred. We also replayed 16 representative fresh-pose gain journeys with both readings biased low across origins, layouts, body variants and occupancies. Every journey restored the body and both chairs.
V18 / SELECTIVE SEATED CORRECTION
A foot-position and toe-angle cue. Starting from the 52 mm mark, the cue prompted 182 of 7,653 held-out cases at each origin to shift 2 mm outward. 46 cases at C1 and 54 at F1b gained a seat meeting their needs. Neither layout lost a previously qualifying case. With readings 1 mm less inward and 0.25° less toe-in, the gains fell to 0 and 2.
Measure the marked ankle relative to its prescribed spot, 52 mm inward and 2 mm forward. Let Y be its sideways error in whole millimetres, positive toward the other foot. Let A be the toe angle relative to the prescribed heading, positive toward the other foot, rounded to the nearest 0.25°. Mirror those directions for the other side.
Shift 2 mm outward when 13 ≤ Y + 3A < 15. Otherwise keep the 52 mm placement. For example, +7 mm inward and 2.25° toe-in gives 13.75 and prompts the shift. At the same +7 mm and 1.50°, the score is 11.5 and the foot stays. Forward/back error was considered during fitting and has zero weight in this rule. The cue uses just the measurements available before departure.
Each count compares the same cases with fixed 52 mm. A case may stay in its original seat. The qualification-first rule assumes an accurately stated scent preference and scores a seat against scent exposure, visual contact and the movement budget. Moving requires the checked return to the original 52 mm pose and restoration of both chairs.
| Start (each n = 7,653) | Rule | Gained | Lost | Met all needs |
|---|---|---|---|---|
| C1 | Fixed 52 mm | 0 | 0 | 7,246 |
| C1 | Shift at every departure | 56 | 103 | 7,199 |
| C1 | Pre-departure cue | 46 | 0 | 7,292 |
| C1 | Shift only with advance knowledge of failure | 56 | 0 | 7,302 |
| F1b | Fixed 52 mm | 0 | 0 | 7,417 |
| F1b | Shift at every departure | 63 | 107 | 7,373 |
| F1b | Pre-departure cue | 54 | 0 | 7,471 |
| F1b | Shift only with advance knowledge of failure | 63 | 0 | 7,480 |
The cue recovered 46 of 56 possible gains at C1 and 54 of 63 at F1b in the held-out cases. Using source-balanced case weights, the share meeting all needs rose by 0.59 and 0.69 percentage points, respectively. Basic occupancy and five additional seated occupants gave identical gain and loss outcomes, case for case, in B′72 and B72.
| Start | Prompted | Return opened | Already passed | Still blocked | Return lost |
|---|---|---|---|---|---|
| C1 | 182 | 147 | 5 | 30 | 0 |
| F1b | 182 | 149 | 5 | 28 | 0 |
Opening a return helps someone gain a suitable seat only if the new destination meets their needs and their previous choice did not. The geometry counts above include every prompted case. They therefore exceed the seat gains.
| Start | Prompted | Newly met | Lost | Met at fixed 52 → with cue |
|---|---|---|---|---|
| C1 | 755 | 239 | 0 | 28,351 → 28,590 |
| F1b | 755 | 254 | 0 | 29,020 → 29,274 |
This replay includes calibration cases. Both layouts gained the same individual cases at each origin. Each origin reuses the panel, so the two rows are separate comparisons.
With the actual foot motion fixed, reading the ankle 1 mm less inward and the angle 0.25° less toe-in across all held-out cases reduced the gains to 0 at C1 and 2 at F1b. Across the tested common readout offsets, gains ranged from 0 to 51 at C1 and 2 to 55 at F1b, with zero seat losses. We tested −1, 0 and +1 mm per position axis and −0.25°, 0 and +0.25° of heading error. The rule ignores forward/back error. Each common-bias test applied the same offset to everyone. A separate bound allowed each case its own worst reading in that set. Then zero gains were guaranteed at either origin, and no previously qualifying case could lose its seat under the tested offsets. We did not sample random observation errors or measure human readout accuracy.
Before evaluation, we divided the 874 rating-source identities into two groups and assigned contiguous position and heading tiles to alternating groups. Each full tile spans four 1 mm readings on each position axis and four quarter-degree heading readings. Both origins and both mirrored feet used the same partition. We fitted the rule on 7,411 cases. All 7,653 confirmation cases came from different source identities and different tiles. We locked the thresholds before scoring any confirmation case. Because the held-out tiles alternate with calibration tiles, confirmation tests interpolation within the sampled range. Wider errors and different body sizes require separate tests.
Calibration compared angle thresholds and simple position–angle scores against the V17 fixed and shifted geometry. A candidate that prompted rail contact or lost a previously possible return during calibration was excluded. Among the remaining candidates, we maximised F1 for newly opened returns across the two origins. F1 equals twice the number of useful prompts divided by the sum of all prompts and all recoverable departures. Exact ties went to the rule with fewer active terms and inequalities, then fewer prompts, then the earlier catalogue entry. Seat outcomes were evaluated after the rule was locked. A second calculation reproduced the seat counts in all eight origin, layout and occupancy combinations. We replayed 16 held-out gain journeys end to end and checked the starting body, both chairs and the existing V16 route. The comparisons apply to the tested foot-error range of ±8 mm on each axis and ±3° in toe heading, with two broader body models at the mirrored 8° start.
V17 / 52 → 50 MM / MATCHED ROUND TRIPS
From 52 mm to 50 mm while seated. Requiring the 2 mm outward shift before every trip left 161 fewer cases with a qualifying seat at C1 and 174 fewer at F1b. Under the accurate scent-report assumption, C1 gained 283 cases and lost 444. F1b gained 299 and lost 473. Every loss involved contact with the starting chair’s floor rail during the shift.
The same 30,000 virtual cases started at each origin in B′72 and B72. The foot began at its actual 52 mm placement, including the assigned position and toe-angle errors. While seated, the case slid the same foot 2 mm farther from its other foot, kept the toe heading, completed the 50 mm departure and the V16 route, and reversed the sequence back to its original 52 mm pose.
As in the V16 accurate-report baseline, every case supplies its correct scent-preference band. The qualification-first rule selects a reachable seat that meets the scent, visual-contact and movement-budget conditions whenever one exists. In this comparison, a case could also choose to stay without moving its foot. Each count compares matched cases with the fixed 52 mm rule.
| Start | Rule | Gained | Lost | Met / 30,000 |
|---|---|---|---|---|
| C1 | Fixed 52 mm | 0 | 0 | 28,351 |
| C1 | Shift before every trip | 283 | 444 | 28,190 |
| C1 | Shift only when fixed 52 mm would block departure | 283 | 0 | 28,634 |
| F1b | Fixed 52 mm | 0 | 0 | 29,020 |
| F1b | Shift before every trip | 299 | 473 | 28,846 |
| F1b | Shift only when fixed 52 mm would block departure | 299 | 0 | 29,319 |
Both layouts produced the same changes for the same individuals, with basic occupancy and with five extra seated occupants. The selective rule uses the simulation’s advance knowledge of who would be blocked at 52 mm. Its gains are an upper bound for a rule that would need an observable signal before rising.
This group wanted at least 10% lower exposure and already had a destination meeting the contact and budget tests. Only their original departure was blocked. The columns after the group total show mutually exclusive outcomes of the correction.
| Start | Blocked group | Already in contact at 52 mm | Contact during slide | Blocked after slide | Completed return |
|---|---|---|---|---|---|
| C1 | 507 | 66 | 0 | 158 | 283 (55.8%) |
| F1b | 541 | 73 | 0 | 169 | 299 (55.3%) |
All 283 C1 and 299 F1b cases that the earlier pre-set 50 mm screen identified gained a qualifying seat when their checked seated movement was joined to the verified destination routes. At C1 they selected C1-N1. At F1b the choices were spread over five destinations. Giving equal total weight to each of the 874 rating sources in the original panel, the share recovered among the blocked group was 55.4% at C1 and 54.6% at F1b.
For this stricter comparison, both arms require a valid actual starting pose, including for a stay. At each origin, 182 of 30,000 cases began in contact with the chair rail, leaving 29,818 valid starts. A staying case in the compulsory arm must slide out and back while seated.
| Start | Met at fixed 52 | Met with compulsory shift | Gained | Lost |
|---|---|---|---|---|
| C1 | 28,248 | 27,308 | 283 | 1,223 |
| F1b | 28,917 | 27,964 | 299 | 1,252 |
Across all 30,000 geometry assignments at each origin, 1,268 started clear and hit the rail during the slide. These are movement failures. A loss in the tables additionally requires that the same case previously had a seat meeting its needs.
The local check covered 139,876 combinations of origin, mirror, XY error and toe heading. The marked ankle followed the assigned error through 52, 51 and 50 mm. Each 1 mm leg movement used a solved knee position and a swept envelope between successive meshes, with floor and seated support checks. The two broader body profiles used the same foot geometry. A separate 3D check of 480 sampled combinations agreed on the failure stage or pass and checked the original fixed-52 outcome.
We replayed 48 complete gain trips across the six newly selected destinations, both broader bodies, both layouts and both occupancy conditions, plus 16 fixed-52 controls. Every replay restored both chairs and the original pose and reproduced its V16 route from the centred pose. Other case outcomes combine the checked local movement with those verified routes. The correction adds 4 mm of ankle travel over the return trip. The model measures movement burden by horizontal pelvis travel, which stays fixed during the foot slide. These results describe a simulated sliding foot. Friction, balance and a person’s ability to decide when to apply the correction remain unmeasured.
V16 / MATCHED ROUTE TEST / 52 MM FOOT MARK
Shorter round trips at the 52 mm mark. Keeping each case’s movement limit, 47 of 1,133 previously unmet cases at C1 and 46 of 464 at F1b could reach a seat meeting their scent and contact needs. The same cases gained in B′72 and B72.
Each origin reused the same 30,000 virtual cases as V15. This comparison follows the cases whose departure was open and whose accurate scent request called for at least 10% lower exposure at the destination. Each had a seat meeting that exposure target and its requirement for visual contact with the original group. The full trip to that seat and back exceeded its movement budget. We counted a gain when the qualification-first rule selected a seat meeting all three conditions after the route change.
| Start | Over budget before | Newly met | Still over budget | Newly met, source-weighted |
|---|---|---|---|---|
| C1 | 1,133 | 47 (4.1%) | 1,086 | 4.2% |
| F1b | 464 | 46 (9.9%) | 418 | 10.1% |
Each row applies separately to either layout, at basic occupancy and with five more seated occupants. The percentage in parentheses counts each case once. Source-weighted recovery gives the 874 source identities equal total weight in the original panel before conditioning on the cases over budget.
Plan details use the straight-boundary layout. A and B mark the walking pads. Dashed amber shows the previous walk and solid aqua the selected walk, used in both directions. An amber dot marks the former destination pad where it differs. The distances below include rising, handling both chairs, sitting, returning and restoring the starting posture.
| Existing destination | Full round trip, before → after¹ | Distance saved | Newly qualifying cases selecting it |
|---|---|---|---|
| C1-N1 | 23.53 → 23.27 m | 0.26 m | 47 |
| C1-N2 | 24.11 → 23.66 m | 0.45 m | 0 |
| F1b-N1 | 15.84 → 14.56 m | 1.28 m | 15 |
| F1b-N2 | 17.64 → 17.17 m | 0.47 m | 0 |
| F1b-N3 | 17.56 → 17.22 m | 0.34 m | 18 |
| F1b-N5 | 21.03 → 20.46 m | 0.58 m | 13 |
| F1b-N6 | 26.62 → 25.92 m | 0.69 m | 0 |
| F1b-OLD | 44.85 → 41.26 m | 3.59 m | 0 |
¹ Before and after distances use the broader body at the left-turned start in B′72 with basic occupancy. A single saving means that every combination of the two broader bodies, layouts and occupancies had the same saving to the nearest 0.01 m. A range gives the minimum and maximum. Each case appears once in the last column, even when it could qualify at more than one destination.
For example, the F1b-OLD trip was up to 3.59 m shorter. Even the closest case to qualifying at this destination needed a reduction of 27.30 m, so this particular shortcut brought no new case within budget.
Before the search, the median reduction needed at the best seat meeting scent and contact needs was 4.53 m at C1 and 3.06 m at F1b. A shorter path benefits a case only when its full trip fits the original budget.
We tested paths to the 8 existing destinations that met at least one residual case’s scent and contact needs. The search generated 60 distinct alternatives between release pads. Straight path segments had to leave room for a 600 mm walking disc in both layouts, including the swept areas of the operated chairs. The search varied the intermediate waypoints and tried other documented destination pads where available.
F1b-N1 and F1b-OLD used another destination pad. This changed the standing approach between the walkway and the destination chair. We replayed that connection, including entry and exit, with the original destination seat, grip, chair pull and reset settings.
Across 148 alternative-route replays, 8 destination routes qualified for use. A route had to complete both directions for the two broader body models and a reference body in both layouts and occupancies, restore both chairs and the starting body, save at least 10 mm, preserve grip reach and chair travel, and add at most 1° of total rigid turning.
We directly replayed both mirrored 20 mm / 8° starts at the 52 mm mark for every selected route across its test conditions. Within any one broader-body, layout and occupancy combination, we directly replayed one side with a nonzero foot error. For the opposite side and other passing foot errors in that combination, we joined the previously verified seated departure and its reverse to the new route at the same centred pose. The study covers this finite set of paths and body models.
| Start | Seat rule | B′72 gained / lost | B72 gained / lost |
|---|---|---|---|
| C1 | Accurate scent request, qualification first | 47 / 0 | 47 / 0 |
| C1 | Predicted scent request, qualification first | 21 / 5 | 21 / 5 |
| C1 | Direct predicted preference | 21 / 0 | 17 / 2 |
| F1b | Accurate scent request, qualification first | 46 / 0 | 46 / 0 |
| F1b | Predicted scent request, qualification first | 65 / 38 | 65 / 37 |
| F1b | Direct predicted preference | 106 / 84 | 107 / 82 |
Each entry compares the same 30,000 cases before and after the route change. Counts refer to meeting all three model conditions. Direct preference ranks reachable seats by predicted utility. A shorter route changes that ranking as well as the travel cost. These are simulated choices under a specified budget.
V15 / 52 MM / BROAD-BODY, TURNED-START SIMULATION
52 mm / best case with an accurate scent preference. Of the cases that missed their needs, 7,197 of 8,893 at C1 and 6,739 of 7,765 at F1b already had a suitable, reachable choice. With an exact scent preference, the rule selects a qualifying seat whenever one exists. That sets the ceiling in both layouts.
Each origin had the same 30,000 virtual cases drawn from 874 rating-source identities. We followed every case whose selected seat missed at least one need at 52 mm under the qualification-first rule. A seat qualifies if it meets the case’s scent-exposure, social-contact and movement-burden conditions. The original seat is a valid choice. Moving requires a verified return trip.
| Start | Unmet with prediction | No reachable qualifying choice | Qualifying choice missed, then recovered | Share of initial misses recovered |
|---|---|---|---|---|
| C1 | 8,893 | 1,696 | 7,197 | 80.9% |
| F1b | 7,765 | 1,026 | 6,739 | 86.8% |
Counts apply separately to B′72 and B72, with basic occupancy or five added stationary occupants. Each row uses the initial misses at its own origin as the denominator for recovery. The same cases were reused in all settings.
C1. Counting each of the 30,000 cases once, the share meeting all needs rose from 70.36% to 94.35% (+23.99 percentage points). Of the cases recovered, 6,954 selected a qualifying destination and 243 selected their original seat. Giving every source identity equal total weight, 81.3% of the initial misses were recovered.
F1b. Counting each of the 30,000 cases once, the share meeting all needs rose from 74.12% to 96.58% (+22.46 percentage points). Of the cases recovered, 3,562 selected a qualifying destination and 3,177 selected their original seat. Giving every source identity equal total weight, 87.1% of the initial misses were recovered.
The largest group helped at C1 wanted lower exposure: 6,504 of the 7,197 recovered cases in each layout. At F1b, 3,562 wanted lower exposure, while 3,160 in B′72 and 3,161 in B72 wanted to retain it. The remaining 17 and 16 cases, respectively, had no scent threshold.
| Reason at 52 mm | C1 | F1b |
|---|---|---|
| Departure blocked; a destination would meet the needs if reachable | 506 | 537 |
| No candidate meets all needs; departure was also blocked | 57 | 25 |
| Departure open; none of the available choices met every need | 1,133 | 464 |
Every remaining case sought at least 10% lower exposure than at the original seat. Among those whose departure was open, removing only the movement cap in a diagnostic calculation would give each one a qualifying destination. These cases still count as unmet under the original cap.
In the baseline, the rule used predicted scent pleasantness to infer one of three requests: at least 10% less exposure, no scent threshold, or at least 90% of the original exposure. For the disclosure test, each case supplied the correct band from its archived source rating (below 35, 35–65, or above 65). Only the scent band used to identify qualifying seats changed. The same predicted utility ranked the options, using the same known contact preferences, movement costs and reachable seats. When no option passed the filter, the rule used its usual preference ranking.
With a complete, correct report, the rule filters seats using the same three conditions used to score the outcome. Every previously unmet case with a qualifying choice therefore selects one. No previously satisfied case lost satisfaction. This is a best-case simulation of reporting; the rate at which people report their preferences accurately was not measured.
| Start | Moved (%) | Unmet wish to move (model points) | Score below best reachable choice (model points) |
|---|---|---|---|
| C1 | 64.9 → 69.8 | 1.88 → 1.66 | 0.8 → 0.8 |
| F1b | 50.7 → 50.5 | 3.67 → 4.30 | 1.5 → 1.2 |
Arrows compare predicted with stated scent preference. Each column averages all 30,000 cases per origin; the two layouts match at the precision shown. The wish-to-move measure counts the case’s assigned desire to withdraw when it stays, and zero when it moves. The final column compares the chosen seat with the highest-scoring reachable choice using the archived rating for both. At F1b, more cases met the three seat conditions even as the average unmet wish to move rose.
At C1 the two layouts recovered exactly the same cases. At F1b, the totals matched but 2 individual cases had different recovery outcomes across layouts. The cases still unmet after disclosure were identical across layouts at both origins. This comparison reuses the two broader body models, mirrored 8° turned starts, 2 mm forward / 52 mm inward ankle mark and 11 candidate destinations from the preceding study. C1-N4 is excluded when occupied.
Previous study: the same cases at the 50 mm and 52 mm marks →
V14 / ACCESS AND SEAT CHOICE
50 → 52 mm in the broad-body, turned-start test. Across 30,000 paired cases, qualification first gave C1 192 gains and 137 losses (net +55), and F1b 405 gains and 335 losses (net +70). Both layouts had these totals. Some gains came from staying in a qualifying original seat when departure became blocked, including 21 at C1 and 76 at F1b in B′72. Direct preference had no gains in overall satisfaction at C1.
A case succeeds when the seat it selects meets all three modelled needs for scent exposure, desired contact and movement burden. Staying in the original seat can qualify. A person who stays does not have to attempt the marked departure.
Each row follows the same 30,000 virtual cases from the 50 mm mark to the 52 mm mark. “Gained” means unmet at 50 mm and met at 52 mm. “Lost” means the reverse. Counts are virtual cases. Percentages in parentheses give each of the 874 underlying rating-source identities equal total weight.
| Origin / layout | Choice rule | Gained | Lost | Still unmet | Met at both |
|---|---|---|---|---|---|
| C1 / B′72 | Direct preference | 0 (0.00%) | 2 (0.01%) | 11,657 (38.51%) | 18,341 (61.48%) |
| C1 / B72 | Direct preference | 0 (0.00%) | 1 (<0.01%) | 11,658 (38.51%) | 18,341 (61.48%) |
| C1 / B′72 and B72 | Qualification first | 192 (0.65%) | 137 (0.44%) | 8,756 (28.92%) | 20,915 (69.99%) |
| F1b / B′72 | Direct preference | 360 (1.17%) | 309 (1.02%) | 9,108 (30.25%) | 20,223 (67.55%) |
| F1b / B72 | Direct preference | 360 (1.17%) | 309 (1.02%) | 9,111 (30.26%) | 20,220 (67.54%) |
| F1b / B′72 and B72 | Qualification first | 405 (1.34%) | 335 (1.09%) | 7,430 (24.66%) | 21,830 (72.91%) |
Basic occupancy and five added stationary occupants produced the same transition counts and weighted percentages. Each row applies separately to each occupancy.
This second measure requires the selected destination to meet all needs and the person to move there. Staying counts as unmet for this measure. The figures below are raw case counts.
| Origin / layout / occupancy | Choice rule | Gained | Lost | Still without a qualifying move | Qualifying move at both |
|---|---|---|---|---|---|
| C1 / B′72 / both occupancies | Direct preference | 447 | 283 | 19,254 | 10,016 |
| C1 / B72 / both occupancies | Direct preference | 448 | 283 | 19,254 | 10,015 |
| C1 / B′72 and B72 / both occupancies | Qualification first | 626 | 390 | 15,468 | 13,516 |
| F1b / B′72 / both occupancies | Direct preference | 453 | 277 | 19,455 | 9,815 |
| F1b / B72 / both occupancies | Direct preference | 453 | 277 | 19,457 | 9,813 |
| F1b / B′72 and B72 / both occupancies | Qualification first | 537 | 336 | 17,664 | 11,463 |
C1, B′72, basic occupancy. Moving the mark opened the assigned departure for 1,268 cases and blocked it for 770. Of the 192 gains under qualification first, 171 were toe-out cases that sought lower exposure and reached a qualifying destination. The other 21 were toe-in cases whose move became blocked and whose original seat met their needs. Of the 137 losses, 106 were cases seeking lower exposure. Among the 8,756 cases that missed at both marks, 1,590 had no reachable qualifying option at 52 mm and 7,166 had one but selected a different seat.
F1b, B′72, basic occupancy. Moving the mark opened the assigned departure for 1,268 cases and blocked it for 767. Of the 405 gains under qualification first, 329 were toe-out cases that sought lower exposure and reached a qualifying destination. The other 76 were toe-in cases whose move became blocked and whose original seat met their needs. Of the 335 losses, 201 were cases seeking lower exposure. Among the 7,430 cases that missed at both marks, 825 had no reachable qualifying option at 52 mm and 6,605 had one but selected a different seat.
At C1 in B′72, direct preference gained 447 qualifying moves, but none of those cases gained satisfaction overall. Their original seats had already met their needs. For qualification first, C1 and F1b had the same four raw transition totals in both layouts. At F1b two individual cases nevertheless fell into different categories across layouts.
With the mark fixed at 52 mm in B′72, switching from direct preference to qualification first gave 3,449 gains and 683 losses at C1, and 2,069 gains and 417 losses at F1b. Changing the rule had a larger net effect on satisfaction than moving the mark by 2 mm in this panel.
We used the archived virtual preference cases, the base preference and movement scenario, and the primary needs test. A low source scent rating (below 35) calls for at least 10% less exposure. A high rating (above 65) calls for at least 90% of the original exposure. Desired contact and the movement cap apply across rating bands. Direct preference chooses the reachable seat with the highest predicted utility. Qualification first ranks the same choices, first considering those predicted to meet all needs, and falls back to direct preference when none qualify. Both use the same predicted scent rating, social preferences and movement costs. The source rating is used to score the outcome after selection.
Each virtual case was assigned one of two broader body models and one of two mirrored starts with equal probability. The body starts 20 mm to one side with an 8° turn. We drew each position offset uniformly from −8 to +8 mm in 1 mm steps, and toe heading uniformly from −3° to +3° in 0.05° steps. The mark was always 2 mm forward. Every case kept the same body, side, position error, toe angle and preference values across marks, origins, layouts, occupancies and rules. These synthetic assignments describe a stress test. Their frequencies in people are unknown.
We evaluated every cell of this position and angle grid. A passing seated departure and its reverse had to join a verified round trip for the assigned body and occupancy. All 11 candidate destinations were covered, with C1-N4 occupied in the five-extra-occupant condition. Across the two marks, two origins and two mirrored starts, 279,752 foot-grid cells were classified. Each result applies to both broad shapes. Their feet and lower legs have identical geometry, and both already passed the whole-body check at zero toe angle throughout each position square. We checked each body’s destination routes separately. Both completed the same routes and their pelvis travel distances agreed within numerical precision. Separate 3D checks reproduced 3,584 sampled classifications, including cases where one mark passed and the other was blocked. A further 84 complete replays reproduced the route frames and restored the start and chairs across every available destination, layout, occupancy and body combination. We used the full pelvis travel distance, including seated recentring, for each moving choice. Other seats and starts remain outside this study.
V13 / FOOT MARK AT THE TURNED START
V13 / turned start. With ±8 mm of error on each position axis, moving the ankle mark from 50 to 52 mm inward changed the sampled toe-out limit from 0.10° to 2.10° and the toe-in limit from 2.10° to 1.50°. Both layouts gave the same result.
The seated body starts 20 mm to one side and turned 8° toward that side. Only the inward position of the ankle mark on that side changed. Forward remained 2 mm. Toe-in points toward the opposite foot. The selected mark gave the most room in the tighter direction on this 1 mm ladder: 1.50° compared with 0.10° at 50 mm.
| Inward ankle mark | Toe-in | Toe-out | Either direction |
|---|---|---|---|
| 50 mm · baseline | 2.10° | 0.10° | 0.10° |
| 51 mm | 1.80° | 1.10° | 1.10° |
| 52 mm · selected | 1.50° | 2.10° | 1.50° |
| 53 mm | 1.20° | 3.05° | 1.20° |
| 54 mm | 0.90° | 4.00° | 0.90° |
| 55–60 mm | The ±8 mm position square already failed at zero toe angle. | ||
Each limit is the last passing sample from zero, in 0.05° steps, across every 1 mm combination of forward/back and side-to-side error in the ±8 mm square (289 positions). Both errors can occur together. We compared marks at 1 mm intervals and selected the highest “either direction” value, using the smallest move on a tie.
At 1.55° toe-in, a placement 3 mm forward and 8 mm inward of the mark made the foot meet the opposite foot while the seated body turned back to centre. At 2.15° toe-out, a placement 8 mm back and 8 mm outward of the mark made the foot meet the chair’s floor rail at the starting pose. Moving inward trades clearance from the chair rail for space beside the opposite foot. At the 55 mm mark, 8 mm back and 8 mm farther inward put the left thigh into the seat shell at setup, even with no toe rotation.
The marked foot holds its angle while the seated body recentres and the ankle slides back to neutral, then straightens before the fixed route. The return reverses this sequence. We paired the same left and right starts, two broader synthetic bodies, five destinations and available occupancies in B′72 and B72. C1-N4 uses basic occupancy only.
At zero toe angle, the full 3D seated movement was checked at every grid position. At nonzero angles, we screened the swept foot against nearby obstacles and the opposite lower leg. A conservative envelope could clear several positions at once; when it touched an obstacle, we split the group to locate an individual blocked position. Passing seated movements joined the previously verified route.
Separate 3D mesh checks agreed with the screen’s pass/fail classification in all 640 tests of the last passing and first blocked angles at the local boundaries. Another 2,048 checks passed using matched fractional placements and headings at the baseline and selected marks. We replayed 360 complete trips, including 344 at the selected mark and 16 baseline controls. Every replay restored the original body pose, toe heading and both chairs, with the same middle route as before.
These are geometric results for this sampled ladder and these bodies. A failure could lie between sampled settings. The angles do not establish human comfort, balance or foot-placement accuracy. The 25 mm mark for a start without the body turn was unchanged.
PREVIOUS V12 / TOE HEADING AT THE TWO FOOT MARKS
V12 / toe heading. With up to 8 mm of position error on each axis, the turned start passed every sampled angle from zero through 2.10° toe-in and 0.10° toe-out. With up to 16 mm of error on each axis, the start without a body turn passed every sampled angle from zero through 0.45° toe-in and 0.90° toe-out. These last passing samples apply to both broader bodies in B′72 and B72.
The marked foot is on the same side as the seated shift. At the turned start, its ankle target is 50 mm inward and 2 mm forward. Without the body turn, it is 25 mm inward. Toe-in turns the toes toward the opposite foot. Toe-out turns them away. The angle is measured around a vertical axis through the marked ankle, relative to the foot’s prescribed heading.
| Starting pose | Position error on each axis | Last toe-in pass | Last toe-out pass |
|---|---|---|---|
| 20 mm shift + 8° body turn | Exact mark | 4.65° | 8.60° |
| 20 mm shift + 8° body turn | ±4 mm | 3.30° | 4.25° |
| 20 mm shift + 8° body turn | ±8 mm | 2.10° | 0.10° |
| 20 mm shift only | Exact mark | 7.60° | 15.85° |
| 20 mm shift only | ±8 mm | 5.55° | 11.15° |
| 20 mm shift only | ±16 mm | 0.45° | 0.90° |
Each row requires a complete return for every 1 mm forward/back and inward/outward grid point in the stated square, in both mirrored poses. A position error of ±8 mm allows 8 mm on both axes at once. We tested angles outward from zero in 0.25° steps and checked each first pass-to-fail bracket in 0.05° steps. For each listed limit, the next 0.05° sample blocked at least one required case.
The left and right starts were tested separately. For example, at C1 with ±4 mm of position error the inward limit was 3.35° on the left and 3.30° on the right. The table uses the smaller angle across all contexts.
With the body turn. At the exact mark, the first inward failure came at 4.70° as the two foot envelopes met while the body turned back to centre. The first outward failure came at 8.65° against the chair’s floor rail at setup. With the full ±8 mm position error, a placement 8 mm back and 8 mm outward already met that rail at 0.15° toe-out. The inward limit was set by the opposite foot during recentring.
Without the body turn. At the exact mark, the toe-in case first met the chair rail at 7.65° as the ankle slid back to neutral. The toe-out case first met it at 15.90° during the final foot pivot. At 16 mm back and 16 mm outward, the first failures occurred at setup, at 0.50° inward and 0.95° outward.
The marked foot begins at the specified ankle position and angle. It keeps its angle relative to the body during seated recentring, then slides to the neutral ankle position. It pivots back to its prescribed heading in steps of at most 1° before the fixed trip begins. The return reverses these movements and restores both chairs and the original toe angle. In these models the middle of the toe edge is 193 mm ahead of the ankle and the heel edge is 93 mm behind it. A 5° turn therefore displaces their centres sideways by about 17 mm and 8 mm respectively.
The position-and-angle comparisons combine checked seated movements with the previously verified route through one of five destinations. The two synthetic bodies have 10% greater girth and one also has an upper body 80 mm higher. C1 and F1b use both 72-seat layouts and both available occupancy conditions, with C1-N4 restricted to basic occupancy.
For the integer grid, the screen compared the swept foot prism with obstacle footprints clipped to the height of the foot. It could clear a group of positions at once. When the group envelope intersected an obstacle, the search split the group to find an individual blocked placement. Within the foot’s working area, the obstacle footprints matched across both layouts and occupancies at each origin, and the floor supported the sole. The marked leg’s knee and thigh stayed above the foot. The screen padded the curved sweeps of the foot and the opposite lower leg. Full 3D checks covered the bracket boundaries, fractional samples and direct replays. A narrow failure could occur between sampled settings. Human foot-angle accuracy, balance and comfort remain unmeasured.
The separate 3D mesh checks agreed with the screen on all 768 last-pass and first-failure cases at the individual source boundaries. A further 144 separately seeded position-and-angle combinations included fractional interior positions and edge positions at the nonzero position tiers. Applied to both mirrored poses, both bodies and eight starting environments, all 4,608 held-out checks passed. B′72 and B72 agreed in these matched checks.
We also replayed 320 whole trips from start to finish. Of these, 144 used a limiting angle at the exact ankle mark, 144 used a limiting angle with a full-square corner offset, and 32 reproduced the V11 zero-toe-angle controls. Signed cases and corners were distributed across destinations, and each B′72 case had the same inputs in B72. Every direct replay restored the starting body and both chairs and reproduced the original middle frames.
PREVIOUS V11 / FIXED ROUTE · REVISED FOOT MARKS
V11 / revised foot marks. Moving the 50 mm inward mark 2 mm forward increased the common square from ±7 to ±8 mm for the turned start. Without the turn, moving the mark from 10 to 25 mm inward increased it from ±1 to ±16 mm. These are sampled round trips for both broader body models in both layouts. Both settings also passed the separate fractional-offset checks.
Use the foot on the side of the 20 mm seated offset. Forward follows the seated body’s heading; inward means toward the other foot. The other foot and both headings stay at their prescribed starting positions. Only the foot mark changes.
| Starting pose | Original → selected mark | Original → selected half-width | Passing integer positions per side at selected mark |
|---|---|---|---|
| 20 mm shift + 8° turn | 50 mm inward → 2 mm forward, 50 mm inward | ±7 → ±8 mm | 289 |
| 20 mm shift only | 10 mm inward → 25 mm inward | ±1 → ±16 mm | 1089 |
Each dot is one tested mark. Its height is the largest centred square in which every integer pair of forward/back and inward/outward errors passed for both mirrored poses, both body shapes and every available context. The ring identifies the selected mark. Ties go to the smaller change.
The 2 mm forward shift clears a previously blocked combination: 8 mm back plus 4 mm inward now passes. At the new mark, 9 mm outward still reaches the floor rail. Moving the mark farther forward up to 20 mm does not enlarge the square. With no turn, the original 10 mm mark already fails 2 mm outward. The 25 mm mark gives the most room on this ladder. At the 30 mm inward mark (20 mm added), 16 mm back plus 15 mm more inward brings the thigh into the seat shell at setup.
The next 1 mm ring contains at least one failure in each case. 20 mm shift + 8° turn: at the left-side mark, 9 mm outward fails at C1 because the foot meets the chair floor rail at setup. 20 mm shift only: at the left-side mark, 17 mm outward fails at C1 because the foot meets the chair floor rail at setup.
Last passing integer millimetre before the first failed sample, with the other error fixed at zero. The values below require both left and right starts. An asterisk marks the end of a search without failure.
| Pose | Mark | Forward (mm) | Back | In | Out |
|---|---|---|---|---|---|
| 20 mm shift + 8° turn | 50 mm inward | 56 | 8 | 15 | 8 |
| 20 mm shift + 8° turn | 2 mm forward, 50 mm inward | 54 | 10 | 15 | 8 |
| 20 mm shift only | 10 mm inward | 52 | 19 | 63 | 1 |
| 20 mm shift only | 25 mm inward | 52 | 18 | 48 | 16 |
We locked the ranking before testing fractional errors. For each mark and each side, we tested 96 seeded interior points and half-integer offsets on each edge, spaced 1 mm apart. For example, on a ±8 mm edge the varying coordinate runs from −7.5 to +7.5 mm. Original and selected marks use the same normalized interior draws, scaled to their own squares. These checks did not select the winners.
Both sides passed every interior and edge sample within each mark’s own square, for the original as well as the revised marks.
We also applied the selected square’s fractional errors to the original mark. This asks whether the original mark meets the larger target; the test window was chosen for the revised mark. These counts combine both mirrored poses and are not estimates of typical human success.
| Same absolute errors at both marks | Pose/offset pairs | Original mark passed | Selected mark passed |
|---|---|---|---|
| 20 mm shift + 8° turn | 320 | 310 / 320 | 320 / 320 |
| 20 mm shift only | 448 | 258 / 448 | 448 / 448 |
The integer-square and fractional results above are composed round trips: each uses the checked seated departure and return together with the previously verified, unchanged route middle. Only the 320 replays below ran the whole sequence afresh. A valid prefix joins the exact centred body state. The fixed middle reaches one destination and returns with both chairs restored; the seated movement then reverses to the actual starting feet. The furniture, both 72-seat layouts and the V8 route geometry stay fixed.
The study covers 8,696 distinct pose/foot coordinates across eight starting environments and two synthetic bodies: both use 10% greater girth, and one also has an upper body 80 mm higher. Of the 139,136 local results, 126,080 were newly evaluated and 13,056 reused exact V10 results. C1-N4 is basic-occupancy only; the other four destinations use both occupancies. Across 156,528 matched B′72/B72 route comparisons, 0 differed in outcome.
Separately, 320 of 320 direct end-to-end replays passed. We replayed each selected mark across all 36 destination, occupancy, layout and body combinations per pose. A second placement per combination sampled corners, edge midpoints and fractional errors, paired identically across layouts; the stress placement rotated across destinations. Original-mark controls reproduced the archived frame hashes. All passed replays restored the starting body and both chairs, with the entire route middle matching its original frames.
These are alternate seated starting positions for two synthetic body shapes. The square describes the tested millimetre lattice; fractional samples do not prove continuous clearance, human accuracy, balance or comfort. The main viewer retains its original D1 loop.
PREVIOUS V10 / FOOT-MARK TOLERANCE · C1 + F1b
V10 / foot placement. When the seated body starts 20 mm off centre and turns 8° to the same side, the 50 mm inward foot mark allows some error. Every tested 1 mm grid point within ±7 mm in both directions completed the modelled round trip in B′72 and B72. At ±8 mm, some combinations failed.
Start seated, 20 mm left with an 8° left turn, or 20 mm right with an 8° right turn. The foot on that side starts 50 mm toward the other foot. All errors below are measured from that mark in the seated body’s forward and inward directions. The other foot, the pelvis and both foot headings keep their prescribed starting positions.
| Error from the 50 mm mark | Last tested pass | First tested failure | What blocked it |
|---|---|---|---|
| Forward | 56 mm | 57 mm | The foot meets a low table base during the seated turn. |
| Backward | 8 mm | 9 mm | The thigh meets the seat shell at setup. |
| Further inward | 15 mm | 16 mm | The two foot envelopes overlap during the seated turn. |
| Outward | 8 mm | 9 mm | The foot meets the chair floor rail at setup. |
With the other error at zero, we sampled every 5 mm to 150 mm forward and back, and 40 mm inward and outward. We then sampled each first pass-to-fail bracket at 1 mm. “First failure” means at least one required context failed; it does not classify all larger errors. For lateral error alone, 42 and 65 mm inward from the original foot location still passed; 41 and 66 mm did not. The left and right poses gave the same numbers. At 57 mm forward, the left-turn pose failed at F1b and the right-turn pose failed at C1.
Of 289 points per pose on the 5 mm grid, 50 passed and formed one connected group. Within that grid the passing points span 5 mm back to 40 mm forward and 5 mm outward to 15 mm further inward; 40 mm forward is the edge of this map, and the separate forward-axis test continued to 56 mm. The ±9 mm detail has 361 distinct integer pairs per pose: 121 from the central ±5 mm grid, eight from the axial refinement, and 232 additional pairs. Of these, 325/361 passed. All 225 points in the centred ±7 mm square passed per pose; the ±8 mm square passed at 284/289 points. On the outermost ±9 mm ring, 41/72 passed. For example, 8 mm backward and 4 mm further inward each passed alone. Together they brought the thigh into the seat shell while the body turned back to centre. The square describes tested millimetre marks; it does not guarantee clearance between them.
The entries are the last consecutive sampled passes from each mark, in mm, along each axis. We tested every 5 mm to 40 mm. “40*” marks the end of the search: 40 mm passed, and larger errors on that ray were not tested. A zero means the first 5 mm sample failed. Paired left/right poses gave the same limits. These five sets of limits combine checked seated movements with the verified route middle. Only nominal marks received direct replay spot checks here; their error limits did not.
| Starting pose | Nominal foot mark | Forward | Back | In | Out |
|---|---|---|---|---|---|
| 20 mm left or right | Same-side foot, 10 mm inward | 40* | 15 | 40* | 0 |
| 30 mm back | Both feet, 15 mm forward | 35 | 10 | 40* | 10 |
| 8° left or right turn | Same-side foot, 40 mm inward | 40* | 10 | 25 | 15 |
On each diagonal, both error components increase together by 5 mm per step. In order (back/out, back/in, forward/out, forward/in), the last passing component sizes were 20 mm left or right: 0, 15, 0, 40* mm; 30 mm back: 10, 10, 10, 40* mm; 8° left or right turn: 10, 5, 15, 25 mm. For the 30 mm rearward pose, both feet received the same forward error and equal inward or outward errors relative to one another. Independent errors of the two feet were not tested.
Each placement had to pass both broader body models in all eight starting environments: C1 or F1b, straight or curved layout, and basic or additional occupancy. Each valid seated sequence reached the exact neutral body pose, joined the unchanged V8 route, and reversed to the perturbed starting pose. The five destinations give 18 available route contexts per body; C1-N4 is basic-only. Each pose and foot offset gives 18 comparisons between layouts: nine available destination/occupancy combinations × two bodies. The composed round-trip outcomes matched in all 1,711 × 18 = 30,798 pairs.
We checked 1,711 pose/offset combinations × 16 body/environments (27,376 local checks). The invariant route middle was reused. Separately, 746 full trips were rerun from start to finish, including all four single-axis last passes and all four limiting-square corners in every available context for both combined poses. All restored the perturbed body and both chairs; every middle matched its archived frame hash. The 82 zero-error replays also reproduced the complete V9 frame hash and check count.
The model checked seated support, floor contact and swept contacts during the outward and reversed seated movements. Leg lengths were preserved at the foot-slide keyframes; the greatest measured segment shortening between passing slide keyframes was 0.0075 mm. No foot-heading error, balance, friction or comfort was tested. These geometric results apply to sampled points and two synthetic bodies. The existing D1 loop shows the original comparison.
PREVIOUS V9 / SEATED FOOT PLACEMENT · FIXED ROUND TRIPS
V9 / seated foot placement. With the feet already at the selected marks, both broader body models completed the round trip from all seven previously blocked seated poses in B′72 and B72. Each body returned to the same foot placement. The checks cover five V8 destinations, one per trip.
| Seated offset or turn | Adjusted starting foot placement | Full trips passed |
|---|---|---|
| 20 mm left | Left foot · 10 mm inward | 36 / 36 |
| 20 mm right | Right foot · 10 mm inward | 36 / 36 |
| 30 mm back | Both feet · 15 mm forward | 36 / 36 |
| 8° left turn | Left foot · 40 mm inward | 36 / 36 |
| 8° right turn | Right foot · 40 mm inward | 36 / 36 |
| 20 mm left with an 8° left turn | Left foot · 50 mm inward | 36 / 36 |
| 20 mm right with an 8° right turn | Right foot · 50 mm inward | 36 / 36 |
Offsets and turns describe the original seated pelvis. The foot adjustment is relative to that start. “Inward” means toward the other foot. Each row covers two broader shapes across 18 combinations of destination, layout and occupancy. C1-N4 was available only at basic occupancy.
The original centred and 30 mm forward starts already passed. With the selected placements, all nine start types complete the cycle for both broader shapes at all five seats. Across the 90 seat, body and start combinations, the count rises from 20 to 90 when success requires both layouts and every available occupancy.
The simulated foot met the chair’s floor rail in six of the seven pose types. In the 30 mm rearward pose, the shin met the seat shell. Each revised trip starts seated with the feet already at the listed placement. The pelvis keeps the same initial offset and turn.
The first panel offered 102 placements, varying the left foot, right foot or both together in forward and lateral directions. Its largest inward adjustment was 40 mm per moving foot. Candidates were ranked by total ankle displacement and required to work for both broader shapes, both origins, both layouts and each available occupancy. The search stopped at the first common passing setting for each pose. Five pose types qualified in this panel.
After the two combined turns remained blocked, a separately declared extension added 84 placements at 50, 60, 70 and 80 mm inward. For those two poses we screened all 186 settings across both broader shapes and the eight distinct starting environments. That gives 5,952 local checks of the starting setup and its available recovery. The table reports the first qualifying tested setting in the relevant panel. Intermediate distances and other foot orientations remain open.
Local checks passing at each extended inward distance were 50 mm (144/672), 60 mm (144/672), 70 mm (0/672), 80 mm (0/672). These counts include different legs, forward offsets and starting environments. At 70 and 80 mm, some initially clear poses subsequently produced overlapping limb envelopes while recentring.
At setup, the pelvis offset, pelvis turn and foot headings match the archived pose. The leg model places each ankle and solves for a forward-bending knee. The leg solver preserves thigh and shin lengths at every seated keyframe. During the one-foot slides, swept checks enclose linear movement of the mesh vertices between keyframes. The greatest segment shortening within these tested slide intervals was 0.0075 mm. Both soles must have floor support and the seated pelvis must remain supported by the chair. The checks include swept collisions with the furniture and occupants, between the two legs, and between the distal legs and the upper body.
The body recentres using the existing seated translation and turn, carrying the adjusted feet along the floor. Once centred, each adjusted foot slides back to its usual mark in steps of up to 5 mm, left first if both move. The simulation then runs the V8 trip with 150 mm departure and destination cuts. On return it reverses the seated sequence and checks the starting body and both chairs. The mesh comparison covers geometric motion. Feet can slide in this model, and balance, grip on the floor and human comfort remain unmeasured.
Direct adjusted-start replays completed 252 of 252 trips. For each pass, the entire V8 route from the centred state through final reseating matched the archived frames. Eight separate centred or 30 mm forward control trips reproduced their original records. The unadjusted seated check reproduced all 144 historical outcomes across two body shapes, eight start environments and nine poses. The two broader shapes both use +10% girth, with one also having an upper body 80 mm higher. Results apply to this tested panel.
PREVIOUS V8 / DESTINATION-CORNER TEST · FURNITURE FIXED
V8 / destination corners: All five seats passed with a 150 mm destination cut and the same 150 mm departure cut. Both broader shapes could reach the seat, sit, rise and return to their starting position in B′72 and B72. The same furniture and 72 seats were used throughout. The two broader shapes could start from only two of the nine tested poses.
At these five seats, V7’s 150 mm departure cut cleared the first chair, but its 200 mm destination cut brought a knee into the destination chair shell. V8 changes how far the path cuts across the destination corners on entry and exit. A 150 mm cut joins points up to 150 mm back from each corner, capped at 45% of either adjoining leg. It describes the path, not a gap between body and chair. The route between the chairs, the grip, the 300 mm chair pulls and the 150 mm departure cut are fixed. A 0 mm destination cut still has a 150 mm departure cut; the true original uses untrimmed connectors at both ends.
Each number below is a complete, centred round trip in the basic occupancy condition: two synthetic shapes at +10% girth (one also +80 mm in upper-body height), each in two layouts. A pass includes sitting at the destination, rising, returning, reseating and restoring both chairs. The rightmost column also requires all seven shapes and all available occupancies to pass.
| Seat | 150 mm | 100 mm | 50 mm | 0 mm | Selected destination cut |
|---|---|---|---|---|---|
| C1-N4 | 4/4 | 4/4 | 4/4 | 4/4 | 150 mm |
| C1-OLD | 4/4 | 4/4 | 4/4 | 4/4 | 150 mm |
| F1b-N3 | 4/4 | 4/4 | 4/4 | 4/4 | 150 mm |
| F1b-N5 | 4/4 | 4/4 | 4/4 | 4/4 | 150 mm |
| F1b-N6 | 4/4 | 4/4 | 4/4 | 4/4 | 150 mm |
The five selected routes passed all 126 centred checks: seven shapes across 18 available seat/layout/occupancy combinations. C1-N4 is basic-only because its seat is occupied in the five-additional-occupant condition. F1b-OLD was resolved in V7 and is unchanged; it is outside these five seats.
No executed new candidate cycle stopped at a collision.
The revised trips saved 0.394–0.426 m relative to the original routes for the reference body. The table uses the reference body’s full horizontal pelvis trace. The last column compares the selected route with V5’s shorter route, which passed for the reference body but failed for the two broader shapes. An incomplete path is never used as a round-trip distance.
| Seat | V7 selection / true original | V8 selected | Saved vs original | Change vs V5 |
|---|---|---|---|---|
| C1-N4 | 21.298 m | 20.902 m | 0.396 m | +0.075 m |
| C1-OLD | 8.563 m | 8.169 m | 0.394 m | +0.067 m |
| F1b-N3 | 17.940 m | 17.515 m | 0.425 m | +0.076 m |
| F1b-N5 | 21.412 m | 20.993 m | 0.419 m | +0.060 m |
| F1b-N6 | 27.001 m | 26.575 m | 0.426 m | +0.070 m |
The original routes already served the valid starts. Of 315 paired seat–shape–pose combinations, 165 complete both the V7 selection and the V8 selection; 150 are blocked at setup. V8-only: 0; V7-only: 0; neither from a valid setup: 0. For both broader shapes, only the centred start and the 30 mm forward start are valid. The destination change cannot fix a foot or chair conflict present before departure.
The predeclared screen ran all four destination cuts for both broader shapes in B′72 and B72 at basic occupancy (80 cycles). Starting with the deepest passing cut, we then tested every remaining shape/layout/available-occupancy combination until one cut qualified per seat. Screen results are reused in this confirmation. The cut must restore body and chairs, keep grip reach and chair travel within the original values, add no more than 1° of cumulative rigid turning and have a complete trace no longer than the same shape’s original.
Of 504 possible centred candidate cycles, 186 were run once: 186 passed and 0 stopped at a collision. 318 individual cycles were not run under the declared screening and stopping rules; their outcomes are unknown. The deepest tested qualifying cut is a selection on this grid, not a continuous threshold or a shortest-path proof. Layout pass/fail disagreements among executed pairs: 0. Among adjacent depths in the full broader-shape screen, pass-to-fail or shorter-at-shallower reversals: 0.
Separately, 30 control replays reproduced archived frame hashes, collision checks and first failures: ten true-original passes (broader), ten V7 passes (reference), and ten V7 knee collisions (broader). Four direct offset-start runs at C1-OLD and F1b-N6 reproduced the selected middle frames in both layouts and restored the broader shape to its 30 mm forward start. The nine-start results reuse V6’s geometry-checked seated recovery and reverse path with exact neutral joins. They are assembled outcomes, not nine new independent solver runs per route.
These seven geometric shapes are synthetic. The 600 mm reach diagnostic was not rerun. No clearance margin, comfort, population coverage or change in scent preference is inferred. The blue ducts, black figures and D1 loop remain reference views; they do not animate the V8 paths.
Previous test: departure corners and the five destination collisions →
PREVIOUS V7 / DEPARTURE-CORNER TEST · FURNITURE FIXED
V7 / less aggressive departure corners: 1 of the six targets gains a new origin-only motion that completes the centred round trip for all seven tested body envelopes, both layouts and every available occupancy condition. 5 retain the longer true-original choreography as a fallback. New common motion: F1b-OLD (150 mm origin trim). A restored original path is not counted as a new shortcut. Initial starting-pose conflicts remain unchanged.
The test isolates the origin connector. It is used on departure and in reverse when returning to the original seat, so both uses change together. The destination connector retains V5’s 200 mm corner trim. Its grip, 300 mm chair pulls, fixed inter-pad route, furniture and all 72 seats stay unchanged. A 0 mm origin trim is therefore a hybrid; it is not the true original, which also has an untrimmed destination connector.
150, 100, 50 and 0 mm origin trims were declared before execution. A corner trim cuts diagonally between points that distance from a corner, capped at 45% of each adjacent leg. All seven V6 synthetic shapes are tested, including the two +10% girth profiles. A table cell counts shapes that complete the centred round trip in both B′72 and B72 and every available occupancy world. C1-N4 remains basic-only because its seat is occupied in the five-added-occupant world.
| Target | 150 mm | 100 mm | 50 mm | 0 mm | Selected common motion |
|---|---|---|---|---|---|
| C1-N4 Basic only | 5/7 | 5/7 | 5/7 | 5/7 | True original / fallback |
| C1-OLD | 5/7 | 5/7 | 5/7 | 5/7 | True original / fallback |
| F1b-N3 | 5/7 | 5/7 | 5/7 | 5/7 | True original / fallback |
| F1b-N5 | 5/7 | 5/7 | 5/7 | 5/7 | True original / fallback |
| F1b-N6 | 5/7 | 5/7 | 5/7 | 5/7 | True original / fallback |
| F1b-OLD | 7/7 | 7/7 | 7/7 | 7/7 | 150 mm origin trim |
For each target, selection takes the deepest declared trim that passes all seven shapes and all contexts, with no increase over the same-body original in arm-chain maximum or chair travel, at most 1° extra cumulative rigid turning, and a full body-centre trace no longer than the original. If none qualifies, the already verified true original is retained as a fallback. A single new trim qualifying across all six targets: none. Selection and evaluation use this same finite panel; this is not a held-out generalisation result.
V5’s 200 mm origin trim fails at the departure chair’s knee clearance for these six targets. The table below lists actual first failures in the new basic B′ runs for the two broader profiles. It does not count skipped added-occupant runs as executed failures. A later failure means departure was traversed, but the full round trip was not completed. An unexecuted return cannot be claimed clear.
| Target | First failing stage | Part | Object / evidence |
|---|---|---|---|
| C1-N4 | S5 destination seat and push | kneeR | Activity 5 S6/Folded seat shell 8 profile–depth cases |
| C1-OLD | S5 destination seat and push | kneeL | Activity 5 S4/Folded seat shell 8 profile–depth cases |
| F1b-N3 | S5 destination seat and push | kneeR | Activity 3 S1/Folded seat shell 8 profile–depth cases |
| F1b-N5 | S5 destination seat and push | kneeL | Activity 3 S4/Folded seat shell 8 profile–depth cases |
| F1b-N6 | S5 destination seat and push | kneeR | Activity 3 S6/Folded seat shell 8 profile–depth cases |
| F1b-OLD | No first failure in the four new depths | — | Both broader profiles complete all four in basic B′; paired results are above. |
Fallback targets: C1-N4, C1-OLD, F1b-N3, F1b-N5, F1b-N6. Any unchanged destination trim that now blocks entry is a separate next experiment. The destination connector is held fixed throughout this run. There are 0 B′72/B72 pass/non-pass disagreements in the new declared contexts; this does not establish a boundary-shape advantage.
The complete horizontal pelvis-centre trace includes chair handling, standing, walking, sitting, rising and return. The comparison below uses the reference body, for which V5 completed all six trips. A failed broad-body V5 prefix is not used as a complete-trip distance. “Given back” compares the selected motion, including any original fallback, with V5.
| Target | True original | V5 / 200 mm | Selected | Given back to V5 | Still saved vs original |
|---|---|---|---|---|---|
| C1-N4 | 21.298 m | 20.827 m | 21.298 m | +0.471 m | 0.000 m |
| C1-OLD | 8.563 m | 8.102 m | 8.563 m | +0.461 m | 0.000 m |
| F1b-N3 | 17.940 m | 17.439 m | 17.940 m | +0.501 m | 0.000 m |
| F1b-N5 | 21.412 m | 20.933 m | 21.412 m | +0.479 m | 0.000 m |
| F1b-N6 | 27.001 m | 26.505 m | 27.001 m | +0.496 m | 0.000 m |
| F1b-OLD | 45.278 m | 44.777 m | 44.807 m | +0.030 m | 0.471 m |
A longer selected trace can surrender earlier movement-burden gains. No virtual-user policy replay, utility gain, fatigue improvement or positive clearance margin is claimed. The V5 user-choice figures remain a separate nominal-body historical result.
The same nine V6 rigid whole-body starts and recentering strategy are retained. Each middle begins and ends centred with both chairs restored; the same checked recovery and exact reverse return join it. These unchanged V6 recovery components are reused under frozen geometry/body/context hashes. Their initial conflicts do not disappear when the later departure corner changes. The feet can slide in the geometric recovery; balance and gait remain unvalidated.
Valid starts below are poses per profile, common to both task origins and all retained contexts. Centred counts are targets; the selected column includes true-original fallbacks.
| Synthetic profile | Valid starts / 9 | V5 centred / 6 | Selected centred / 6 |
|---|---|---|---|
| Reference | 5/9 | 6/6 | 6/6 |
| Girth −10% | 7/9 | 6/6 | 6/6 |
| Girth +10% | 2/9 | 0/6 | 6/6 |
| Upper body −80 mm | 5/9 | 6/6 | 6/6 |
| Upper body +80 mm | 5/9 | 6/6 | 6/6 |
| Girth −10% / upper body −80 mm | 7/9 | 6/6 | 6/6 |
| Girth +10% / upper body +80 mm | 2/9 | 0/6 | 6/6 |
Across 378 target–shape–start cells: 180 initial setup conflicts, 174 pass both V5 and the selected motion, 24 pass only the selected motion, 0 pass only V5, and 0 valid starts complete neither. Of the selected-only cells, 4 are enabled by a new tested origin trim and 20 by restoring the true original. These are correlated synthetic combinations, not percentages of people.
The new grid contains 616 possible centred middles: seven shapes × 22 target/layout/world contexts × four depths. 552 were executed: 472 passed and 80 failed. The other 64 were not run because their identical basic-world path already failed. Adding static occupants cannot remove that collision, but can create an earlier one, so an unrun added-world first failure remains unknown.
Combining the new middles with the archived, independently checked recoveries gives 5,544 logical condition outcomes. This is not 5,544 fresh solver runs or independent trials. Every passing assembly requires exact neutral body-state joins, complete body/chair restoration and an unchanged recovery in that exact layout/occupancy context.
| Logical outcome for the four new depths | Count |
|---|---|
| Complete new candidate cycle passes | 2616 |
| Initial setup conflict | 2640 |
| Recovery fails after valid setup | 0 |
| Executed middle-cycle collision | 160 |
| Grip-chain limit | 0 |
| Final restoration fails | 0 |
| Unrun added-world middle / first failure unknown | 128 |
Separate controls reproduce 36 archived V5-depth cycles or failures exactly and 18 true-original cycles exactly, including frame hashes and collision-check counts. The 24 known broad-profile departure collisions are retained as negative controls. Four direct monolithic replays also check the selected full cycle plus a 30 mm forward starting offset, for the broader profile at C1-OLD and F1b-OLD in both layouts; these match the assembled frames and restore the starting body and both chairs. Controls are separate from the 616-cell search grid.
The collision engine changes only its origin-trim parameter lookup. Body envelopes, triangle collision tests, swept body/chair logic, floor checks and rigid-turn arc bounds remain intact. The tested depth ladder has 0 shape–target sequences that pass at a deeper depth but fail at the next shallower tested depth. Among adjacent depths that both complete, 0 basic B′72 profile–target comparisons become shorter when the trim is reduced (1e−6 m numerical comparison tolerance). Pointwise outcomes are retained without interpolating a universal safe cutoff.
These are seven declared geometric shapes, not measured people or body percentiles. Lower-leg lengths remain fixed; upper-body height and girth vary as defined in V6. The 600 mm reach control is an archived V6 diagnostic outside this selection gate; it was not rerun. Neither realistic joints, strength, balance, comfort nor a positive whole-cycle clearance margin is established.
For targets still using a fallback, the next controlled simulation should vary the destination corner separately while keeping an accepted departure connector fixed, then recheck the complete return against the true original. That experiment has not been run here. Furniture, 72 seats, current viewer dimensions, the automatic D1 loop, blue D2 ducts and black illustrative figures are unchanged. The retained visuals do not animate V7 trajectories. Native Rhino files and private full-motion traces remain excluded from both website upload folders.
V6 body definitions and starting-pose evidence → · V5 shortening and historical user-choice results →
PREVIOUS V6 / BODY + STARTING-POSE SENSITIVITY · FURNITURE FIXED
V6 / body and starting pose: With the +10% girth envelope, 6 destinations pass the original motion but fail the shorter one: the 200 mm corner trim brings a knee into the departure chair. The original choreography should remain a comparator for any future profile-specific rule. Across valid starts in the complete panel, 24 combinations pass only the original and 0 only the shorter. All 24 losses come from the two +10% girth profiles, each with two valid starts at six destinations. These synthetic envelopes do not establish population coverage; V5’s virtual-user results remain conditional on its reference body.
Both the original and V5 shorter choreography are tested under the same body, starting pose, layout and fixed occupants. A common pass requires B′72, B72 and every available occupancy world to pass. The furniture and all 72 seats stay fixed. C1 has five retained destinations; F1b has six. C1-N4 is unavailable with five added occupants and is tested in the basic world only.
At a centred start, the shorter cycle passes 66/88 destination–profile combinations, compared with 78/88 for the original choreography. These counts include 0 initial setup conflicts; the paired table separates them.
These are declared synthetic geometric variations, not measured people, anthropometric percentiles or a representative body population. The 20-part model retains its 485 mm seated pelvis-bottom contact and floor-level soles. Girth changes lateral span, part cross-sections and depth; upper-body height changes the torso, neck, head and shoulder position. Lower-leg lengths stay fixed, so this is not a complete stature study. The original geometric posture morphs are retained, not replaced with fixed-bone biomechanics.
The arm is rebuilt from the changed shoulder to the same measured chair-back grip point. The hand remains tangent to that surface. The arm-chain cap remains 700 mm except for one 600 mm functional-reach condition; that condition has the reference body shape and is not an eighth distinct shape. This tests a geometric reach envelope, not force, joint limits or an anatomical inverse-kinematics solution. Fixed peers retain their original nominal bodies.
Standing width is the maximum lateral vertex span across all 20 parts in the neutral standing pose: 460 mm for the reference body, set by its elbow boxes at ±230 mm. An earlier 450 mm straight-connector envelope describes a different historical check; it is not this full-body width. The reference body geometry has not changed.
Centred starts only. Counts are destinations with a common complete pass across both layouts and all available worlds. The arrow is original → shorter. Non-passes can include setup and reach problems, not just route collisions.
| Synthetic profile | Standing height / width | Reach cap | C1 / 5 destinations | F1b / 6 destinations |
|---|---|---|---|---|
| Reference envelope | 1.73 m / 460 mm | 700 mm | 5/5 → 5/5 | 6/6 → 6/6 |
| Girth −10% | 1.73 m / 414 mm | 700 mm | 5/5 → 5/5 | 6/6 → 6/6 |
| Girth +10% | 1.73 m / 506 mm | 700 mm | 5/5 → 3/5 | 6/6 → 2/6 |
| Upper body −80 mm | 1.65 m / 460 mm | 700 mm | 5/5 → 5/5 | 6/6 → 6/6 |
| Upper body +80 mm | 1.81 m / 460 mm | 700 mm | 5/5 → 5/5 | 6/6 → 6/6 |
| Girth −10% + lower upper body | 1.65 m / 414 mm | 700 mm | 5/5 → 5/5 | 6/6 → 6/6 |
| Girth +10% + higher upper body | 1.81 m / 506 mm | 700 mm | 5/5 → 3/5 | 6/6 → 2/6 |
| Reference shape / 600 mm reach cap | 1.73 m / 460 mm | 600 mm | 0/5 → 0/5 | 1/6 → 1/6 |
The nine starts use local left/right/forward offsets and rigid seated yaw. The entire body, including its feet, is offset or rotated. The checked recovery first translates the pelvis back to centre while retaining yaw, then removes yaw in steps no greater than 5° with a conservative swept-arc enclosure. Translation is sampled at no more than 20 mm. The reverse sequence at the end restores the exact initial offset and body; both chairs return to rest. Zero offset adds no movement frames.
Initial pelvis support must lie inside the actual seat-top polygon, the soles remain on the floor, and all furniture collisions remain active. Swept seated support is checked during recentering and restoration. Contact with the seat is not required while standing. These recovery motions can slide the feet and are not a validated way for a person to move.
Each cell below counts body/reach profiles out of eight, requiring both layouts and all retained fixed-occupant contexts. Destination duplicates at the same origin are collapsed. A starting conflict is recorded before motion; it is not a failed trip to the destination. A valid initial pose can still fail while recentering.
| Starting pose | C1 valid initial setups | F1b valid initial setups | Recovery passes both ways C1 / F1b |
|---|---|---|---|
| Centred | 8/8 | 8/8 | 8/8 / 8/8 |
| 20 mm left | 6/8 | 6/8 | 6/8 / 6/8 |
| 20 mm right | 6/8 | 6/8 | 6/8 / 6/8 |
| 30 mm forward | 8/8 | 8/8 | 8/8 / 8/8 |
| 30 mm back | 6/8 | 6/8 | 6/8 / 6/8 |
| 8° left yaw | 2/8 | 2/8 | 2/8 / 2/8 |
| 8° right yaw | 2/8 | 2/8 | 2/8 / 2/8 |
| 20 mm left + 8° left yaw | 0/8 | 0/8 | 0/8 / 0/8 |
| 20 mm right + 8° right yaw | 0/8 | 0/8 | 0/8 / 0/8 |
Rigid yaw can rotate a foot into an existing chair sled even before the trip begins. That diagnoses this particular whole-body starting configuration, not an inability of a person to sit at that angle. Independent foot placement, torso-only rotation, balance and alternative settling strategies are not tested here.
The centred +10% girth losses occur at C1-N4, C1-OLD, F1b-N3, F1b-N5, F1b-N6, F1b-OLD. Each uses the 200 mm corner trim. This points to a shallower or untrimmed departure corner as a next paired test, while retaining the original path as a control; that change has not been tested in V6.
Each row contains exactly 72 body/reach × starting-pose cells. Setup conflicts remain visible in the first count and are excluded from the valid-start denominator. The four final columns partition valid starts. “Neither” includes recentering failure, reach limitation and middle-cycle failure; it does not mean both destinations are globally unreachable. All stages after the first failure are unproven. A separate endpoint diagnostic is not continuation through that failure.
| Destination | Setup conflicts | Valid starts | Both pass | Original only | Shorter only | Neither completes |
|---|---|---|---|---|---|---|
| C1-N1 | 34 | 38 | 33 | 0 | 0 | 5 |
| C1-N2 | 34 | 38 | 33 | 0 | 0 | 5 |
| C1-N3 | 34 | 38 | 33 | 0 | 0 | 5 |
| C1-N4 Basic only | 34 | 38 | 29 | 4 | 0 | 5 |
| C1-OLD | 34 | 38 | 29 | 4 | 0 | 5 |
| F1b-N1 | 34 | 38 | 33 | 0 | 0 | 5 |
| F1b-N2 | 34 | 38 | 33 | 0 | 0 | 5 |
| F1b-N3 | 34 | 38 | 29 | 4 | 0 | 5 |
| F1b-N5 | 34 | 38 | 29 | 4 | 0 | 5 |
| F1b-N6 | 34 | 38 | 29 | 4 | 0 | 5 |
| F1b-OLD | 34 | 38 | 34 | 4 | 0 | 0 |
Across 792 destination–profile–pose cells, 374 have an initial setup conflict, 344 pass both choreographies, 24 pass only the original, 0 pass only the shorter, and 50 valid starts complete neither. The cells are correlated synthetic conditions; these totals do not estimate a fraction of people. No pass/non-pass disagreement between B′72 and B72 was found in the declared contexts. This establishes no boundary-shape advantage.
The following counts cover only executed central-cycle failures. They include paired layouts and occupancy contexts and are not independent observations. Starting-pose recovery is reported separately above. Reach-cap failures are distinguished from surface penetration. A failure earlier in the sequence says nothing about a later stage.
| Choreography | First failing stage | Part / constraint | Object | Executed cases |
|---|---|---|---|---|
| Original | S5 vacant chair | arm | declared 0.6m arm chain | 20 |
| Shorter | S5 vacant chair | arm | declared 0.6m arm chain | 20 |
| Shorter | S1–S3 origin departure | kneeL | Activity 2 S4/Folded seat shell | 16 |
| Shorter | S1–S3 origin departure | kneeR | Activity 4 S6/Folded seat shell | 8 |
The shortened cycle’s centred-start results at the three declared levels are shown below. “Non-pass” retains setup and reach restrictions. These are pointwise tests, not a minimum clear width, a safe angle or a fitted threshold. Girth changes also move joint and foot centres, and the grip is rebuilt; larger profiles are not guaranteed to contain the smaller profiles at every point. No body-size monotonicity is assumed.
| Destination | Axis / ordered levels | Common shorter-cycle outcome |
|---|---|---|
| C1-N1 | Girth −10% / reference / +10% | Pass / Pass / Pass |
| C1-N2 | Girth −10% / reference / +10% | Pass / Pass / Pass |
| C1-N3 | Girth −10% / reference / +10% | Pass / Pass / Pass |
| C1-N4 | Girth −10% / reference / +10% | Pass / Pass / Non-pass |
| C1-OLD | Girth −10% / reference / +10% | Pass / Pass / Non-pass |
| F1b-N1 | Girth −10% / reference / +10% | Pass / Pass / Pass |
| F1b-N2 | Girth −10% / reference / +10% | Pass / Pass / Pass |
| F1b-N3 | Girth −10% / reference / +10% | Pass / Pass / Non-pass |
| F1b-N5 | Girth −10% / reference / +10% | Pass / Pass / Non-pass |
| F1b-N6 | Girth −10% / reference / +10% | Pass / Pass / Non-pass |
| F1b-OLD | Girth −10% / reference / +10% | Pass / Pass / Non-pass |
| C1-N1 | Upper body −80 / reference / +80 mm | Pass / Pass / Pass |
| C1-N2 | Upper body −80 / reference / +80 mm | Pass / Pass / Pass |
| C1-N3 | Upper body −80 / reference / +80 mm | Pass / Pass / Pass |
| C1-N4 | Upper body −80 / reference / +80 mm | Pass / Pass / Pass |
| C1-OLD | Upper body −80 / reference / +80 mm | Pass / Pass / Pass |
| F1b-N1 | Upper body −80 / reference / +80 mm | Pass / Pass / Pass |
| F1b-N2 | Upper body −80 / reference / +80 mm | Pass / Pass / Pass |
| F1b-N3 | Upper body −80 / reference / +80 mm | Pass / Pass / Pass |
| F1b-N5 | Upper body −80 / reference / +80 mm | Pass / Pass / Pass |
| F1b-N6 | Upper body −80 / reference / +80 mm | Pass / Pass / Pass |
| F1b-OLD | Upper body −80 / reference / +80 mm | Pass / Pass / Pass |
Across both choreographies, 0 axis sequences contain a non-pass followed by a pass at a higher tested level. Such a change is an outcome of this declared geometry, not evidence that increasing body size generally improves access.
There are 672 possible central cycles: eight body/reach profiles × 42 destination/layout/world contexts × two choreographies. 616 were executed (552 passes, 64 failures). The other 56 were explicitly not run: their identical basic-world cycle already failed, and adding static occupants cannot remove that collision or reach restriction. These are inferred non-passes, not executed failures. The first failure in an unrun added-occupant middle is unknown: extra occupants could create an earlier collision. Its basic-world blocker is retained only as the reason for the non-pass inference. C1-N4’s structurally unavailable occupied condition is outside the 672.
Each passing body-specific middle cycle starts and finishes in the same centred body state with both chairs restored. That identical certified middle is reused across the nine starting poses. Forward recovery is collision- and support-checked separately in each layout and each available occupancy context, with both chairs at rest. Reverse recovery is checked in that same context whenever forward recovery passes; otherwise the complete cycle already fails and reverse recovery is not executed. The join is checked for exact full-precision body-state equality, with component hashes retained privately. The complete outcome is recovery + middle + reverse recovery. A failed middle cannot be rescued by a different initial offset under this fixed recentering strategy.
This produces 6,048 logical condition/choreography outcomes, not 6,048 new full solver runs or independent experiments. They include layout/world repetition and shared central motion. Their first-failure classes are retained below:
| Full condition classification | Logical outcomes |
|---|---|
| Full declared cycle passes | 2724 |
| Initial setup conflict | 2856 |
| Recentering fails after a valid setup | 0 |
| Grip-chain limit exceeded | 200 |
| Certified middle-cycle motion fails | 48 |
| Final starting-pose restoration fails | 0 |
| Added-world middle inferred non-pass / first failure unknown | 220 |
All 84 neutral original/shorter layout/world cycles reproduce V5’s exact saved frame hashes and collision-check counts. Four additional direct whole-cycle controls compare the assembled result with a monolithic replay: two passing translation cases and two rejected combined-yaw cases. Both hashes and statuses agree where applicable. A deliberately unsupported start is rejected. A deliberately altered route aimed through a fixed peer is also rejected, but its first collision is with the departure chair; that control does not isolate peer detection. The original triangle collision functions, swept body/chair logic, rigid-turn arc bounds, furniture meshes and floor are retained.
Only this English evidence and the compact main summary are updated. Furniture, 72 seats, viewer dimensions, automatic D1 loop, blue D2 ducts and black representative figures stay unchanged. Those figures are illustrative and do not display each new body profile. No native Rhino originals or full private motion traces are distributed.
V6 is geometry-only. The V5 virtual-user choices are not recomputed because no body distribution has been assigned to those instances and height-dependent sightline rays have not been recalculated. Its earlier utility and unmet-need results remain conditional on the reference body. This panel establishes neither a positive clearance margin nor comfort, gait, safety certification or population coverage.
The next simulation should first compare shallower and untrimmed departure corners at the six broader-envelope losses. Separately, it should vary foot placement or seated torso orientation while preserving support, then test revised recovery and grip strategies against both original and shorter cycles. That work is not claimed here. Previous V5 shortening and nominal-user results → · Candidate definitions →
PREVIOUS V5 / SHORTER VERIFIED ROUND TRIPS · FURNITURE FIXED
V5 / shorter verified round trips: 11 of 11 existing destinations gain a shorter full body-centre trace (1.1%–17.7%) with the same furniture. Both layouts use the same accepted choreography. In the primary base case, the share with no qualifying action changes from 5.6% to 3.8% at C1 and from 1.8% to 1.5% at F1b. This reduces a modelled movement constraint, not measured fatigue. Some choice outcomes can still worsen. The automatic loop remains the D1 reference field.
After pulling the destination chair, the mover can join the seat-entry connector sooner instead of returning to the old pad and retracing it. Small corner trims are tested separately and in combination. Full outward and return paths between the original pads stay fixed. These are geometric choreography tests with one mover, not gait, energy, timing or comfort measurements.
Before → after is the complete horizontal pelvis-centre trace: departure, chair handling, approach, sitting, rising and return. It is not just walking distance. Each row uses one common choreography for B′72 and B72 and for every available occupancy world. C1-N4 remains unavailable in the added-occupant world because its seat is occupied. OLD denotes the original destination retained as a control; N denotes a previously verified additional destination.
| Target / destination | Full trace before → after | Reduction | Selected choreography | Verified worlds |
|---|---|---|---|---|
| C1-N1 Activity 6 S3 | 26.903 → 23.487 m | 3.417 m / 12.7% | 100 mm trim + side join | Basic + fixed five |
| C1-N2 Front 6 S4 | 27.456 → 24.072 m | 3.384 m / 12.3% | 100 mm trim + side join | Basic + fixed five |
| C1-N3 Activity 6 S1 | 18.081 → 17.771 m | 0.310 m / 1.7% | 100 mm trim + behind join | Basic + fixed five |
| C1-N4 Activity 5 S6 | 21.298 → 20.827 m | 0.471 m / 2.2% | 200 mm corner trim | Basic only |
| C1-OLD Activity 5 S4 | 8.563 → 8.102 m | 0.461 m / 5.4% | 200 mm corner trim | Basic + fixed five |
| F1b-N1 Front 2 S3 | 19.195 → 15.800 m | 3.395 m / 17.7% | 100 mm trim + side join | Basic + fixed five |
| F1b-N2 Front 2 S4 | 20.995 → 17.600 m | 3.395 m / 16.2% | 100 mm trim + side join | Basic + fixed five |
| F1b-N3 Activity 3 S1 | 17.940 → 17.439 m | 0.501 m / 2.8% | 200 mm corner trim | Basic + fixed five |
| F1b-N5 Activity 3 S4 | 21.412 → 20.933 m | 0.479 m / 2.2% | 200 mm corner trim | Basic + fixed five |
| F1b-N6 Activity 3 S6 | 27.001 → 26.505 m | 0.496 m / 1.8% | 200 mm corner trim | Basic + fixed five |
| F1b-OLD Activity 6 S3 | 45.278 → 44.777 m | 0.501 m / 1.1% | 200 mm corner trim | Basic + fixed five |
The catalogue was frozen before execution: 12 modes × 11 destinations, with the baseline included. All 264 basic layout-mode cases were executed. Across available worlds, 374 full-cycle attempts produced 292 passes and 82 failures; 130 added-occupant cases were explicitly not run. Added-occupant tests are skipped when a basic case collides, is not at least 10 mm shorter than the incumbent, or fails the arm/turn/chair non-regression gate. Extra fixed occupants cannot rescue an existing static collision. Skips are not counted as failures.
A new winner must pass every available world and both layouts, end with the same body and both chairs restored, shorten the complete trace by at least 10 mm, and retain the baseline maximum arm-chain length and chair travel. Cumulative rigid turning may not increase by more than the declared 1° numerical tolerance. This is a best accepted result within a finite catalogue and 10 mm replacement tolerance, not a globally shortest path. Twice the fixed inter-pad path length is a loose lower bound on complete horizontal pelvis travel because every cycle must traverse that path in both directions; it was not used to prune candidates or claim global optimality.
| Declared mode | Executed | Passed | Failed | Added-world cases not run |
|---|---|---|---|---|
| Baseline | 42 | 42 | 0 | 0 |
| Half-leg join | 42 | 42 | 0 | 0 |
| Behind-corner join | 42 | 42 | 0 | 0 |
| Side-corner join | 40 | 38 | 2 | 2 |
| 100 mm corner trim | 34 | 34 | 0 | 8 |
| 200 mm corner trim | 32 | 22 | 10 | 10 |
| 100 mm trim + behind join | 24 | 24 | 0 | 18 |
| 100 mm trim + side join | 30 | 28 | 2 | 12 |
| Alternate grip | 22 | 10 | 12 | 20 |
| Alternate grip + behind join | 22 | 10 | 12 | 20 |
| Opposite destination side | 22 | 0 | 22 | 20 |
| Opposite origin side | 22 | 0 | 22 | 20 |
Corner trims replace an internal right-angle bend with a diagonal joining points 100 or 200 mm from its corner, capped at 45% of each adjacent leg. Side offsets remain at their baseline widths; no body shrinking, furniture relocation or collision exemption is used. The original 300 mm chair pulls, pull/rise poses, static geometry, body parts, swept collision checks, rigid-turn arc padding and floor support test are retained. Translation samples are at most 20 mm at the pelvis; rigid turns are at most 5° with the existing arc enclosure. These numerical steps do not establish a positive physical clearance margin.
For all 11 selected cycles, maximum arm-chain length, cumulative rigid yaw and total chair travel are unchanged from baseline. The arm-chain maxima range from 0.539 to 0.614 m, total chair travel is 1.800 m per cycle, and cumulative rigid yaw remains 882–3,589°. The shorter trace does not resolve this retained turning burden. All 42 original accepted layout/world cycles reproduce their exact saved frame hashes and collision-check counts. Two deliberately colliding fixed-peer routes are rejected. Every selected complete saved trace is independently remeasured for distance, stage order, arm reach, turning, continuity and reset. No extra safety buffer is established for the new trims or joins; historical local 50/100 mm buffers must not be applied to these complete cycles.
V4's 30,000 bootstrap instances from 874 source people, 29 trait scenarios, three threshold packages and 16 request-information conditions are replayed unchanged. Only an accepted action's complete trace changes, in both its movement-burden requirement and utility cost. Seat availability, stationary tracer ratios, reciprocal peer rays, rating predictions, synthetic traits, report probabilities and stable tie order stay fixed. Both old and expanded action sets use their improved traces. All 22,272 aggregate conditions are paired with V4; they are not independent trials.
The primary base case below is P2M2C2 in the basic world. Each side of an arrow is B′72 / B72. “No qualifying action” is the opportunity gap; “unmet” also includes an avoidable choice error. Exact-request unmet equals the gap by construction. The mixed channel assumes 25% error among responses and 25% missing answers, with missing answers using the existing prediction. These are synthetic assumptions, not collected replies.
| Task / action set | No qualifying action before → after | Predicted-band unmet before → after | Mixed-channel unmet before → after |
|---|---|---|---|
| C1 / old | 38.7% / 38.7% → 38.7% / 38.7% | 38.7% / 38.7% → 38.7% / 38.7% | 38.7% / 38.7% → 38.7% / 38.7% |
| C1 / expanded | 5.6% / 5.6% → 3.8% / 3.8% | 29.4% / 29.4% → 28.8% / 28.8% | 20.1% / 20.1% → 19.0% / 19.0% |
| F1b / old | 19.8% / 19.8% → 19.6% / 19.6% | 33.1% / 33.1% → 32.9% / 32.9% | 27.8% / 27.8% → 27.6% / 27.6% |
| F1b / expanded | 1.8% / 1.8% → 1.5% / 1.5% | 25.2% / 25.2% → 25.0% / 25.0% | 16.4% / 16.4% → 16.3% / 16.3% |
Primary requirements: ratings below 35 request a ≥10% stationary tracer reduction; ratings above 65 retain ≥90%; company weights ≤3 / ≤9 / >9 request 0 / 2 / 3 reciprocal rays; movement weight × complete trace / 10 must be ≤10. These are model thresholds, not health or accessibility standards. Company, burden and withdrawal traits remain assumed known. C1's qualifying reduction still relies on uncalibrated ratios near 0.90; this run does not recompute transport or improve that uncertainty.
Utility loss before and after uses the same updated expanded-action observed-utility maximum. The before policy retains its actual old trace and old chosen action. This common reference prevents a moving benchmark from disguising the change. The before values differ from those published in V4 because this reference maximum now includes the shorter traces. Values are arbitrary model units. Foregone withdrawal assigns withdrawal need to stays and zero to moves, averaged over all instances with equal total source-person weights. B′72, expanded actions, primary base case:
| Task / information | Common-reference utility loss | Foregone withdrawal | Move share |
|---|---|---|---|
| C1 / Predicted request band | 0.930 → 0.827 | 1.536 → 1.470 | 67.3% → 68.2% |
| C1 / 25% error + 25% missing | 1.119 → 0.994 | 1.380 → 1.308 | 70.6% → 71.8% |
| F1b / Predicted request band | 1.630 → 1.587 | 3.430 → 3.373 | 52.6% → 53.1% |
| F1b / 25% error + 25% missing | 1.828 → 1.788 | 4.063 → 4.019 | 51.2% → 51.6% |
The following overlapping groups use the predicted request band in the same base case. Counts are represented source people / resampled instances; each represented person's included instances receive equal total weight. These are synthetic instance traits, not measured traits of the source people.
| Group | People / instances | Unmet before → after |
|---|---|---|
| C1 / Reduction band + movement ≥4 | 614 / 1,426 | 100.0% → 93.2% |
| C1 / Reduction band + company >9 | 667 / 1,779 | 71.4% → 69.3% |
| C1 / Withdrawal ≥14 | 872 / 9,036 | 29.6% → 29.0% |
| F1b / Reduction band + movement ≥4 | 614 / 1,426 | 70.2% → 66.5% |
| F1b / Reduction band + company >9 | 667 / 1,779 | 39.3% → 38.2% |
| F1b / Withdrawal ≥14 | 872 / 9,036 | 23.6% → 23.3% |
Across all 22,272 matched conditions, unmet decreases in 14,428, increases in 6,012, and is unchanged in 1,832. The change spans -3.274 to +0.636 percentage points. These are condition counts, not people, and include exact duplicate outcomes from the two occupancy worlds: removing that duplication leaves 11,136 conditions (7,214 decreases, 3,006 increases and 916 unchanged). They are not independent observations. The largest increase is the correlated withdrawal-and-burden scenario, B′72 / C1 / basic world / original destination only / strict thresholds / fixed middle request band: 39.9% → 40.5%. Shorter traces expand burden eligibility, but can change utility ranking and the chosen action under an imperfect request. Therefore a smaller opportunity gap does not guarantee fewer unmet choices in every condition.
Opportunity gaps never increase in any paired condition. Policy aggregates remain identical between basic and fixed-plus-five worlds; only C1-N4 availability differs, so those worlds are not independent robustness evidence. Neither paired result establishes an advantage from the curved boundary.
Furniture, 72 seats, blue ducts, black figures, viewer dimensions and the automatic D1 loop are unchanged. The representative images and D1 field loop are retained reference views; they do not animate these new V5 trajectories. No physical pilot, new behavioural training or transport solve is claimed. Raw respondents, full private trajectories and native Rhino originals are excluded from the website and upload folders.
The next useful simulation is to test whether these shorter joins retain clearance under body-size and starting-pose variation, with the same perturbations in both layouts. This remains a proposal, not a result of V5. Previous V4 information reliability → · V3 candidate definitions and tracer/ray evidence →
PREVIOUS V4 / REQUEST INFORMATION WITH FROZEN VERIFIED SEATS
With 25% uniformly wrong responses and 25% non-response, expected unmet changes from 29.4% to 20.1% at C1 and from 25.2% to 16.4% at F1b. This is one illustrative assumed communication channel, not a measured response rate or a forecast. At the same time, observed-utility loss rises from 0.867 to 1.056 at C1 and from 1.578 to 1.775 at F1b. This loss combines threshold-versus-utility trade-offs with ranking by a frozen pleasantness prediction that is not updated from the reported request. V4 does not separate those contributions; it does not show that clarifying requests is intrinsically costly. All results use the same virtual instances and the existing verified seats.
No new human answers are collected. The “true request” is still constructed from an existing scent rating and synthetic thresholds. Exact requests leave only the pre-existing opportunity gap, 5.6% at C1 and 1.8% at F1b in this base case. That is a structural check of request-first, not a newly demonstrated achievement.
V3's 30,000 resampled instances from 874 source people, 29 trait scenarios, three threshold packages and frozen old/expanded action sets are reused. Only the policy's tracer-request band changes: reduce the stationary tracer index, no tracer target, or retain it. The continuous predicted pleasantness and all utility weights stay frozen, including the utility tie-break. Observed pleasantness is never substituted into this deployable utility. Thus the exact-request condition is different from V3's privileged observed-request AND observed-utility reference.
Company, movement burden, withdrawal and shared-surface weights remain perfectly known synthetic inputs. Noisy reports about these traits are not tested. An error in the believed tracer band is necessary for an avoidable miss under request-first, but is not sufficient: many wrong bands still select a qualifying action. The policy chooses the highest predicted utility among reported-qualifying actions. If none qualifies it flags that fact and falls back to soft utility. Ties prefer stay, then seat ID.
Uniform error chooses either wrong band with equal probability. Adjacent error sends an extreme band to the middle, and the middle to either extreme. Error rates are conditional on responding. Missing answers use the existing predicted band. Except in the named asymmetric condition, non-response is assumed independent of the true band, traits and outcomes. One asymmetric condition makes half of reduction requests missing and leaves other requests exact. The same probabilities and reported states are paired across layouts and every scenario.
Results integrate the three possible reported bands exactly; they are expected shares, with no Monte Carlo response sample or invented participant answers. The odour-mean and frequency controls use only training people in the existing five source-person folds. Frequency draws a band from that training odour's band shares, without individual calibration. Missing ratings are excluded. V4's odour-mean control changes ONLY the hard-request band; V3's separate baseline changed both rating-based utility and the band, so their outcomes need not match.
Base tables below use P2M2C2, primary thresholds and expanded actions in the basic world. Each outcome cell is B′72 / B72. Utility loss uses the same expanded-set observed-utility maximum as V3, in arbitrary model units. Foregone withdrawal is need for stays and zero for moves, averaged over all instances with equal total source-person weights. A met threshold can still coexist with a desire to step back.
| Request information | Effective band error | Unmet B′ / B | Utility loss B′ / B | Foregone withdrawal B′ / B |
|---|---|---|---|---|
| Existing predicted band | 57.7% | 29.4% / 29.4% | 0.867 / 0.867 | 1.536 / 1.536 |
| Training odour-mean band | 58.4% | 30.1% / 30.1% | 0.755 / 0.755 | 1.562 / 1.563 |
| Training odour-band frequency | 60.4% | 31.1% / 31.1% | 1.550 / 1.550 | 1.316 / 1.316 |
| Fixed middle band / not best constant | 68.1% | 38.6% / 38.6% | 0.129 / 0.128 | 1.805 / 1.805 |
| Exact request / ceiling check | 0.0% | 5.6% / 5.6% | 0.900 / 0.902 | 1.312 / 1.312 |
| Uniform error 10% | 10.0% | 10.2% / 10.2% | 0.988 / 0.989 | 1.319 / 1.319 |
| Uniform error 25% | 25.0% | 17.0% / 17.0% | 1.119 / 1.120 | 1.329 / 1.329 |
| Uniform error 50% | 50.0% | 28.3% / 28.3% | 1.338 / 1.338 | 1.345 / 1.346 |
| Adjacent error 10% | 10.0% | 8.9% / 8.9% | 0.891 / 0.893 | 1.340 / 1.340 |
| Adjacent error 25% | 25.0% | 13.9% / 13.9% | 0.878 / 0.880 | 1.381 / 1.381 |
| Adjacent error 50% | 50.0% | 22.1% / 22.1% | 0.857 / 0.858 | 1.451 / 1.451 |
| No error + 25% missing | 14.4% | 11.6% / 11.6% | 0.892 / 0.893 | 1.368 / 1.368 |
| No error + 50% missing | 28.9% | 17.5% / 17.5% | 0.883 / 0.885 | 1.424 / 1.424 |
| 25% error + 25% missing | 33.2% | 20.1% / 20.1% | 1.056 / 1.057 | 1.380 / 1.380 |
| 25% error + 50% missing | 41.4% | 23.2% / 23.2% | 0.993 / 0.993 | 1.432 / 1.432 |
| 50% missing only for reduction requests | 12.5% | 16.4% / 16.4% | 0.646 / 0.647 | 1.481 / 1.481 |
| Request information | Effective band error | Unmet B′ / B | Utility loss B′ / B | Foregone withdrawal B′ / B |
|---|---|---|---|---|
| Existing predicted band | 57.7% | 25.2% / 25.2% | 1.578 / 1.578 | 3.430 / 3.431 |
| Training odour-mean band | 58.4% | 25.6% / 25.6% | 1.491 / 1.491 | 3.393 / 3.394 |
| Training odour-band frequency | 60.4% | 27.9% / 27.9% | 2.615 / 2.613 | 4.164 / 4.164 |
| Fixed middle band / not best constant | 68.1% | 30.5% / 30.5% | 1.012 / 1.010 | 3.267 / 3.267 |
| Exact request / ceiling check | 0.0% | 1.8% / 1.8% | 1.220 / 1.222 | 4.101 / 4.102 |
| Uniform error 10% | 10.0% | 6.5% / 6.5% | 1.469 / 1.470 | 4.170 / 4.171 |
| Uniform error 25% | 25.0% | 13.5% / 13.5% | 1.841 / 1.841 | 4.275 / 4.275 |
| Uniform error 50% | 50.0% | 25.2% / 25.2% | 2.462 / 2.460 | 4.448 / 4.449 |
| Adjacent error 10% | 10.0% | 4.7% / 4.7% | 1.282 / 1.283 | 4.082 / 4.082 |
| Adjacent error 25% | 25.0% | 9.0% / 9.0% | 1.373 / 1.374 | 4.053 / 4.054 |
| Adjacent error 50% | 50.0% | 16.2% / 16.2% | 1.526 / 1.526 | 4.006 / 4.006 |
| No error + 25% missing | 14.4% | 7.6% / 7.7% | 1.310 / 1.311 | 3.933 / 3.934 |
| No error + 50% missing | 28.9% | 13.5% / 13.5% | 1.399 / 1.400 | 3.765 / 3.766 |
| 25% error + 25% missing | 33.2% | 16.4% / 16.4% | 1.775 / 1.775 | 4.063 / 4.064 |
| 25% error + 50% missing | 41.4% | 19.3% / 19.4% | 1.710 / 1.709 | 3.852 / 3.853 |
| 50% missing only for reduction requests | 12.5% | 8.0% / 8.0% | 1.190 / 1.191 | 4.489 / 4.490 |
B′72, the same base case. “Consequential / errors” divides the person-weighted avoidable-miss share by the person-weighted effective band-error share; it is not a fresh average conditional on each person's errors and does not predict whether any particular person's error will matter. False assurance means an action satisfies the believed request but fails the constructed true request; it can include an impossible true request. A flagged fallback is not a successful fulfilment.
| Task / channel | Avoidable miss | Consequential / errors | False assurance | Flagged fallback |
|---|---|---|---|---|
| C1 / Existing predicted band | 23.8% | 41.2% | 27.4% | 3.5% |
| C1 / Uniform error 25% | 11.3% | 45.4% | 12.7% | 5.4% |
| C1 / Adjacent error 25% | 8.3% | 33.0% | 9.7% | 4.8% |
| C1 / 25% error + 25% missing | 14.5% | 43.5% | 16.4% | 4.9% |
| C1 / 50% missing only for reduction requests | 10.7% | 85.6% | 12.5% | 3.8% |
| F1b / Existing predicted band | 23.4% | 40.5% | 24.5% | 1.1% |
| F1b / Uniform error 25% | 11.7% | 46.8% | 12.1% | 1.7% |
| F1b / Adjacent error 25% | 7.2% | 28.7% | 7.6% | 1.6% |
| F1b / 25% error + 25% missing | 14.6% | 44.1% | 15.2% | 1.6% |
| F1b / 50% missing only for reduction requests | 6.2% | 49.2% | 6.8% | 1.2% |
At a 25% error rate with no missing answers, uniform and adjacent errors have different consequences. Therefore the existing predictor's 57.7% band error cannot be equated to a random communication rate. Under the uniform, no-missing assumption only, expected unmet matches the predicted-band baseline at error 52.4% for C1 and 49.9% for F1b. These analytical break-even values concern unmet only, exclude asking effort and are not empirical reliability requirements.
| Task / action set | No qualifying action B′ / B | Predicted unmet B′ / B | 25% error +25% missing unmet B′ / B | Exact request unmet B′ / B |
|---|---|---|---|---|
| C1 / old | 38.7% / 38.7% | 38.7% / 38.7% | 38.7% / 38.7% | 38.7% / 38.7% |
| C1 / expanded | 5.6% / 5.6% | 29.4% / 29.4% | 20.1% / 20.1% | 5.6% / 5.6% |
| F1b / old | 19.8% / 19.8% | 33.1% / 33.1% | 27.8% / 27.8% | 19.8% / 19.8% |
| F1b / expanded | 1.8% / 1.8% | 25.2% / 25.2% | 16.4% / 16.4% | 1.8% / 1.8% |
The opportunity gap does not change with the information channel. Better information cannot make an unverified or unavailable seat usable. Old actions remain in every expanded set, so opportunity gaps cannot increase through expansion.
The following is an exclusive diagnosis of the opportunity gap in B′72 under base traits, not a geometry change. For each no-option instance, remove one requirement at a time and test the SAME actions. Categories list which single relaxations would rescue it; category shares add to the package's gap. “Either tracer or burden” means two separate diagnostic alternatives, not that both must be removed. Each package shows its total gap and the no-single-relaxation category, including zeros; sum the category-share column, not the repeated total column.
| Task / package | Total opportunity gap | Exclusive single-relaxation rescue category | Category share of all weighted instances |
|---|---|---|---|
| C1 / lenient | 0.0% | No single relaxation suffices | 0.0% |
| C1 / primary | 5.6% | No single relaxation suffices | 0.0% |
| C1 / primary | 5.6% | Either tracer or burden | 5.6% |
| C1 / strict | 38.7% | No single relaxation suffices | 0.0% |
| C1 / strict | 38.7% | Tracer only | 38.7% |
| F1b / lenient | 0.1% | No single relaxation suffices | 0.0% |
| F1b / lenient | 0.1% | Either tracer or burden | 0.1% |
| F1b / primary | 1.8% | No single relaxation suffices | 0.0% |
| F1b / primary | 1.8% | Either tracer or burden | 1.6% |
| F1b / primary | 1.8% | Any one of tracer, contact or burden | 0.2% |
| F1b / strict | 37.7% | No single relaxation suffices | 0.0% |
| F1b / strict | 37.7% | Tracer only | 27.3% |
| F1b / strict | 37.7% | Either tracer or contact | 5.3% |
| F1b / strict | 37.7% | Either tracer or burden | 5.1% |
In the primary base case, every remaining gap can be closed diagnostically by removing the burden cap while retaining tracer and contact requests: 5.6% at C1 and 1.8% at F1b. Removing the tracer request also permits staying, so that alternative is not evidence of a better low-exposure seat. For 0.2% of F1b instances, removing the contact request is a further alternative. None of these concessions is applied to the policy or recommended as a solution.
This points to the current verified movement traces as the next spatial question. They are the first passing choreographies, not proven shortest ones. A shorter verified choreography might reduce burden; V4 does not invent one. Under stricter joint targets, information alone leaves much larger gaps. C1's primary reduction still depends on ratios 0.8964 and 0.8990 near the uncalibrated 0.90 boundary.
B′72, primary/base. Counts are source people represented / bootstrap instances; groups overlap. Within each group, average a source person's included instances before giving represented people equal weight. These are instance traits, not measured traits of the source people.
| Group | People / instances | Predicted unmet | 25% error +25% missing unmet | Exact request unmet |
|---|---|---|---|---|
| C1 / Reduction-request band | 819 / 11,704 | 69.9% | 44.6% | 14.9% |
| C1 / Reduction band + movement ≥4 | 614 / 1,426 | 100.0% | 100.0% | 100.0% |
| C1 / Reduction band + company >9 | 667 / 1,779 | 71.4% | 45.9% | 16.5% |
| C1 / Withdrawal ≥14 | 872 / 9,036 | 29.6% | 19.8% | 5.3% |
| F1b / Reduction-request band | 819 / 11,704 | 36.5% | 25.6% | 4.7% |
| F1b / Reduction band + movement ≥4 | 614 / 1,426 | 70.2% | 56.6% | 38.7% |
| F1b / Reduction band + company >9 | 667 / 1,779 | 39.3% | 28.3% | 8.2% |
| F1b / Withdrawal ≥14 | 872 / 9,036 | 23.6% | 15.8% | 1.9% |
B′72, expanded actions. The full computation evaluates all 16 information conditions across all 29 scenarios and three packages; these ranges summarize the existing predictor, illustrative mixed channel and exact-request check. They are stress-test ranges, not confidence intervals or population prevalence. The base tables above report every declared information condition.
| Task / package | Predicted unmet range | 25% error +25% missing range | Exact request / gap range |
|---|---|---|---|
| C1 / lenient | 8.3%–17.0% | 4.1%–9.2% | 0.0%–0.4% |
| C1 / primary | 27.8%–37.1% | 16.9%–34.7% | 0.5%–30.7% |
| C1 / strict | 43.0%–53.3% | 41.5%–45.8% | 38.7%–38.7% |
| F1b / lenient | 10.1%–27.1% | 4.8%–17.4% | 0.0%–6.0% |
| F1b / primary | 23.2%–34.8% | 14.6%–30.7% | 0.1%–24.6% |
| F1b / strict | 38.8%–55.7% | 29.6%–45.5% | 16.4%–38.7% |
Primary: below35 requests ≥10% reduction; above65 retains ≥90%; company ≤3 / ≤9 / >9 requests 0 / 2 / 3 reciprocal rays; weighted full pelvis trace ≤10. Lenient uses 2% reduction /70% retention /20 burden and one fewer ray; strict uses 25% /98% /5 and one extra ray, clipped 0–3. P1/P2/P3 scale scent importance 0.5/1/2, M1/M2/M3 movement 0.5/1/3, and C1/C2/C3 company 0.25/1/3. The two further scenarios couple withdrawal with high burden or mix low/high company and withdrawal. All are inherited assumptions, not health or accessibility thresholds; rays are not demonstrated conversation.
Both occupancy worlds were computed: all reported policy aggregates remain identical. The fixed-plus-five world still changes only C1-N4 availability, without changing aggregate outcomes; it is not a second independent robustness test. The maximum expected paired action disagreement between B′72 and B72 is 0.2% across primary-package scenarios, both action sets, worlds and information conditions. These tiny model differences establish no boundary-shape advantage.
No new furniture, motion path, transport solve, behavioural model or human trial is introduced. All 72 seats, blue ducts, black figures, viewer dimensions and automatic loop remain. Geometric availability comes from the unchanged V3 full-roundtrip checks. Raw respondent rows, detailed trajectories, trained models and native Rhino originals remain private.
Source rating pool: Bierling et al. (2025), olfactory perception dataset v3, CC BY 4.0. Only aggregate simulation results appear here. Previous V3 candidate and policy evidence →
PREVIOUS V3 / VERIFIED ADDITIONAL SEATS + REQUEST-FIRST CHOICE
C1: 4 added seats; F1b: 5 added seats pass the declared full return in both layouts in the basic world. The same 30,000 virtual instances, 29 trait scenarios and original-person weighting are retained. New destinations are offered only after full body-and-chair restoration; no furniture or seat count changes.
A geometric pass is a scripted-envelope result, not human comfort or gait validation. “Request-first” uses predicted preferences, not hidden observed ratings. Neither added seats nor a different rule guarantees every user's requested conditions.
With the base synthetic traits and primary thresholds in B′72, expanding the action set reduces the no-qualifying-action gap from 38.7% to 5.6% at C1 and from 19.8% to 1.8% at F1b. Combining those additions with request-first changes total unmet from 38.7% to 29.4% and from 36.7% to 25.2%, respectively. At C1, added seats alone barely change total unmet (38.7% → 38.6%), and request-first with only the old actions remains at 38.7%; the substantial change needs both. These are person-weighted instance shares, not a share of distinct people. At fixed expanded options, request-first also increases observed-utility loss: C1 0.129 → 0.867 and F1b 0.999 → 1.578, in arbitrary model units. The table separates these effects.
The C1 gap reduction is threshold-fragile: N1 and N2 have worst-layout tracer ratios 0.8964 and 0.8990, only about 0.4 and 0.1 percentage points beyond the 10% line. Under the strict joint package, the C1 base gap remains 38.7%. These uncalibrated stationary ratios do not establish a real-world exposure threshold.
Base traits P2M2C2, primary thresholds, basic world. Each cell is B′72 / B72. “Old” means stay plus the original verified destination; “expanded” retains those actions and adds shared passing candidates. All four combinations use identical virtual users. Loss below uses the same expanded-set observed-utility reference, so action-set comparisons share one benchmark.
| Task / action set / rule | No qualifying action | Total unmet | Avoidable miss | Utility loss | Foregone withdrawal |
|---|---|---|---|---|---|
| C1 / old / soft | 38.7% / 38.7% | 38.7% / 38.7% | 0.0% / 0.0% | 0.134 / 0.134 | 1.804 / 1.805 |
| C1 / old / request first | 38.7% / 38.7% | 38.7% / 38.7% | 0.0% / 0.0% | 0.135 / 0.134 | 1.806 / 1.807 |
| C1 / expanded / soft | 5.6% / 5.6% | 38.6% / 38.6% | 33.0% / 33.0% | 0.129 / 0.128 | 1.802 / 1.803 |
| C1 / expanded / request first | 5.6% / 5.6% | 29.4% / 29.4% | 23.8% / 23.8% | 0.867 / 0.867 | 1.536 / 1.536 |
| F1b / old / soft | 19.8% / 19.8% | 36.7% / 36.7% | 16.9% / 16.9% | 2.516 / 2.514 | 6.293 / 6.294 |
| F1b / old / request first | 19.8% / 19.8% | 33.1% / 33.1% | 13.3% / 13.3% | 2.824 / 2.821 | 6.710 / 6.711 |
| F1b / expanded / soft | 1.8% / 1.8% | 31.0% / 31.0% | 29.2% / 29.2% | 0.999 / 0.997 | 3.181 / 3.182 |
| F1b / expanded / request first | 1.8% / 1.8% | 25.2% / 25.2% | 23.4% / 23.4% | 1.578 / 1.578 | 3.430 / 3.431 |
No qualifying action is an opportunity gap; adding a destination can reduce it. Avoidable misses occur when a qualifying action exists but is not selected. These threshold misses can include a move preferred by the soft utility rule. Foregone withdrawal averages all instances, using the synthetic withdrawal weight for stays and zero for moves, then weights source people equally. It is in model units, not a measured wellbeing outcome. More options can increase unmet conditions under soft utility: at F1b in P1M1C1 / P2M1C1 / P3M1C1, unmet changes from 30.9% / 27.4% / 24.7% to 31.2% / 28.6% / 26.2%. A utility-preferred move may break another request threshold.
B′72, basic world, primary thresholds and base traits. Counts are source people with at least one instance in the group / bootstrap instances. Traits belong to instances. Groups overlap. The final column combines the effect of added seats and the new rule; the four-arm table above separates them.
| Task / group | People / instances | No-option gap old → expanded | Unmet old soft → expanded request-first |
|---|---|---|---|
| C1 / rating below35 | 819 / 11,704 | 100.0% → 14.9% | 100.0% → 69.9% |
| C1 / below35 + movement≥4 | 614 / 1,426 | 100.0% → 100.0% | 100.0% → 100.0% |
| C1 / below35 + company>9 | 667 / 1,779 | 100.0% → 16.5% | 100.0% → 71.4% |
| C1 / below35 + both high traits | 193 / 218 | 100.0% → 100.0% | 100.0% → 100.0% |
| C1 / withdrawal≥14 | 872 / 9,036 | 38.5% → 5.3% | 38.5% → 29.6% |
| F1b / rating below35 | 819 / 11,704 | 51.8% → 4.7% | 77.1% → 36.5% |
| F1b / below35 + movement≥4 | 614 / 1,426 | 100.0% → 38.7% | 100.0% → 70.2% |
| F1b / below35 + company>9 | 667 / 1,779 | 100.0% → 8.2% | 100.0% → 39.3% |
| F1b / below35 + both high traits | 193 / 218 | 100.0% → 55.9% | 100.0% → 74.3% |
| F1b / withdrawal≥14 | 872 / 9,036 | 19.9% → 1.9% | 38.8% → 23.6% |
103 archived origin-seat options were screened using geometry only, with the original three peers fixed. For each origin, take the two shortest planar routes with a worst-layout ratio ≤0.90 at minimum 0, 2 and 3 reciprocal rays, then merge the seat IDs. C1 also includes two short three-ray candidates with ratio ≤0.95. This yields ten declared additional candidates. Planar screening is not full movement verification; the current full-cycle trace, rather than planar distance, supplies the policy burden.
| Candidate | Destination | Screen ratio worst layout | Basic B′ / B | Fixed +5 B′ / B | Full-cycle evidence or last tested failure |
|---|---|---|---|---|---|
| C1-N1 | Activity 6 / S3 | 0.8964 | Pass / pass | Pass / pass | basic: 1,942 states; 26.90 m; 3/3 rays; fixed_plus5: 1,942 states; 26.90 m; 3/3 rays |
| C1-N2 | Front 6 / S4 | 0.8990 | Pass / pass | Pass / pass | basic: 2,033 states; 27.46 m; 0/3 rays; fixed_plus5: 2,033 states; 27.46 m; 0/3 rays |
| C1-N3 | Activity 6 / S1 | 0.9101 | Pass / pass | Pass / pass | basic: 1,589 states; 18.08 m; 3/3 rays; fixed_plus5: 1,589 states; 18.08 m; 3/3 rays |
| C1-N4 | Activity 5 / S6 | 0.9320 | Pass / pass | Occupied / occupied | basic: 1,804 states; 21.30 m; 3/3 rays |
| F1b-N1 | Front 2 / S3 | 0.8949 | Pass / pass | Pass / pass | basic: 1,551 states; 19.20 m; 0/3 rays; fixed_plus5: 1,551 states; 19.20 m; 0/3 rays |
| F1b-N2 | Front 2 / S4 | 0.8680 | Pass / pass | Pass / pass | basic: 1,703 states; 21.00 m; 0/3 rays; fixed_plus5: 1,703 states; 21.00 m; 0/3 rays |
| F1b-N3 | Activity 3 / S1 | 0.8457 | Pass / pass | Pass / pass | basic: 1,544 states; 17.94 m; 2/3 rays; fixed_plus5: 1,544 states; 17.94 m; 2/3 rays |
| F1b-N4 | Activity 3 / S2 | 0.8185 | No shared pass | No shared pass | basic: last declared choice stops at S1–S3 origin departure / B_Activity_2_S5/Folded_seat_shell; fixed_plus5: last declared choice stops at S1–S3 origin departure / B_Activity_2_S5/Folded_seat_shell |
| F1b-N5 | Activity 3 / S4 | 0.8551 | Pass / pass | Pass / pass | basic: 1,871 states; 21.41 m; 3/3 rays; fixed_plus5: 1,871 states; 21.41 m; 3/3 rays |
| F1b-N6 | Activity 3 / S6 | 0.8023 | Pass / pass | Pass / pass | basic: 2,541 states; 27.00 m; 3/3 rays; fixed_plus5: 2,541 states; 27.00 m; 3/3 rays |
Both layouts use the same candidate coordinates and the same chosen archived pad path. If the archives differ, the shorter path, then lexicographic coordinate order, selects one common path to test against both geometries. The study does not search every possible route. The 24 declared choreographies vary origin side, destination side, 550/600/700 mm destination offset and lateral/rear chair grip; origin offset stays 550 mm. Each world stops at its first shared passing choice; an unsuccessful available candidate exhausts the declared set. Later unrun choices are not counted as failures. Movement burden uses the first shared passing choreography, not the cheapest possible choreography. A later pass could have a shorter trace, so burden-limited gaps are upper bounds relative to a cheapest-passing-choreography evaluation of these same candidates.
All eight original task/layout/world controls reproduce their archived frame hashes and check counts. C1 preserves its 836-state original cycle; F1b preserves its 3,455-state trajectory. Current reselected tracer metrics are joined to those unchanged trajectories. New candidates use the unchanged 20-part body, 300 mm chair pull, swept body/chair checks, floor support checks and restoration checks. No collider is removed and no new door operation is assumed.
The excluded candidate is F1b-N4, Activity 3 / S2. With the preferred origin side it reaches the destination area but stops during grip approach or entry at the neighbouring S1/S3 sled feet. With the opposite origin side it stops at the Activity 2 / S5 chair shell. None of the 24 declared choices completes in either layout or fixed world. Later unvisited stages are not treated as tested; this is not proof that the seat can never be reached.
The basic world has the three original peers. The fixed-plus-five world adds the same five occupants at the OLD destination table for every candidate. A candidate at one of those occupied seats is unavailable. Other candidate destinations are concurrently vacant. Visibility is recomputed using this exact world plus the mover at each destination; tracer ratios remain the saved stationary values, not a new occupancy-dependent flow solve. All reported aggregate policy outcomes are identical between these two worlds across all 29 scenarios, three packages and four rules: only C1-N4 is removed, it supplies no unique qualifying option in these tests, and the retained actions' ray counts are unchanged. This duplicated result is not independent evidence of robustness to general occupancy changes.
C1 starts at Activity 4 / S6 with its original three peers; F1b starts at Activity 2 / S4 with a different three-peer group. Their destinations are never pooled. Each virtual replay has one mover and a reserved origin. Other simulated users do not consume candidate seats, so this is not an allocation, competition or crowd model. All 72 physical seats remain.
Both deployable rules receive the same person-held-out predicted pleasantness, scent salience, withdrawal, shared-surface, company and movement weights, and the available action attributes. Soft utility chooses the highest predicted gain. Request-first derives the same rating-band request from that predicted rating, filters for predicted qualifying actions, then uses the SAME soft utility to break ties. If nothing qualifies, it flags the fallback and uses soft utility. Ties prefer stay, then ascending seat ID.
Observed ratings are used only for evaluation and explicitly labelled privileged references. The observed-request reference has zero avoidable misses whenever any qualifying action exists, by definition. It is not an achievable performance claim. The existing preference predictor is frozen; V3 does not retrain a multi-seat choice model or rebrand the V2 binary trees as one.
The person-weighted predicted request-band error is 57.7%, versus 58.4% for a training-person odour-mean predictor without personal calibration. Always choosing the most common evaluation band would err on 61.3% of person-weighted instances; that is a descriptive best-constant benchmark selected from this evaluation mixture, not a trained policy. The personalized predictor improves band error by only 0.7 percentage points over the odour mean. The rule's gains therefore do not establish accurate individual request prediction. Prediction errors can make request-first filter the wrong actions, so it need not lower true unmet conditions in every scenario. Tracer reduction and contact requests do not include withdrawal as a hard condition; a user who strongly wants to step back can count as threshold-met while staying.
Using the same five held-out source-person folds, fit pleasantness means by odour set and odour from training people only, with no personal calibration. This rating supplies both the utility and request-band inputs. No held-out ratings fit the baseline. This diagnostic was added after the first results; it does not tune or replace the primary comparison. P2M2C2, primary thresholds, basic world; cells are B′ / B. The fixed-plus-five results are identical.
| Task / set | Odour-mean request-first unmet | Personalized request-first unmet | Odour-mean utility loss | Personalized utility loss |
|---|---|---|---|---|
| C1 / old | 38.7% / 38.7% | 38.7% / 38.7% | 0.135 / 0.134 | 0.135 / 0.134 |
| C1 / expanded | 30.1% / 30.1% | 29.4% / 29.4% | 0.755 / 0.755 | 0.867 / 0.867 |
| F1b / old | 33.0% / 33.0% | 33.1% / 33.1% | 2.822 / 2.820 | 2.824 / 2.821 |
| F1b / expanded | 25.9% / 25.9% | 25.2% / 25.2% | 1.499 / 1.497 | 1.578 / 1.578 |
With expanded options, the personalized inputs reduce unmet by only about 0.6–0.7 percentage points relative to odour means, while increasing utility loss. This supports testing better request information, not claiming a strong personalized model.
The V2 assumptions are retained without tuning. Primary requests: rating below35 seeks ≥10% tracer reduction; above65 retains ≥90%; middle ratings impose no tracer target. Company weight ≤3 / ≤9 / >9 requests 0 / 2 / 3 peer rays; weighted trace burden ≤10. Lenient uses 2% / 70% / 20 and one fewer ray; strict uses 25% / 98% / 5 and one extra ray, clipped to 0–3. These are joint synthetic packages, not accessibility or health standards.
| Task / world / package | Expanded opportunity-gap range | Expanded request-first unmet range |
|---|---|---|
| C1 / basic / lenient | 0.0%–0.4% | 8.3%–17.0% |
| C1 / basic / primary | 0.5%–30.7% | 27.8%–37.1% |
| C1 / basic / strict | 38.7%–38.7% | 43.0%–53.3% |
| C1 / fixed_plus5 / lenient | 0.0%–0.4% | 8.3%–17.0% |
| C1 / fixed_plus5 / primary | 0.5%–30.7% | 27.8%–37.1% |
| C1 / fixed_plus5 / strict | 38.7%–38.7% | 43.0%–53.3% |
| F1b / basic / lenient | 0.0%–6.0% | 10.1%–27.1% |
| F1b / basic / primary | 0.1%–24.6% | 23.2%–34.8% |
| F1b / basic / strict | 16.4%–38.7% | 38.8%–55.7% |
| F1b / fixed_plus5 / lenient | 0.0%–6.0% | 10.1%–27.1% |
| F1b / fixed_plus5 / primary | 0.1%–24.6% | 23.2%–34.8% |
| F1b / fixed_plus5 / strict | 16.4%–38.7% | 38.8%–55.7% |
Ranges above cover all 29 scenarios for B′72. P1/P2/P3 scale scent-rating importance by 0.5/1/2; M1/M2/M3 scale movement burden by 0.5/1/3; C1/C2/C3 in scenario IDs scale company weight by 0.25/1/3. R1 couples withdrawal with high burden; R2 mixes low/high company and withdrawal. All V2 draws are replayed exactly. C1's roughly 10.4% reduction candidate is only just beyond the primary 10% request in an uncalibrated tracer model; it does not establish a reliable real-world scent threshold.
| Scenario | No-option gap old → expanded B′ / B | Old soft unmet B′ / B | Old request-first unmet B′ / B | Expanded soft unmet B′ / B | Expanded request-first unmet B′ / B |
|---|---|---|---|---|---|
| P1M1C1 | 38.7% / 38.7% → 0.5% / 0.5% | 38.7% / 38.7% | 38.7% / 38.7% | 38.6% / 38.6% | 28.0% / 28.0% |
| P1M1C2 | 38.7% / 38.7% → 0.5% / 0.5% | 38.7% / 38.7% | 38.7% / 38.7% | 38.6% / 38.6% | 28.0% / 28.0% |
| P1M1C3 | 38.7% / 38.7% → 0.5% / 0.5% | 38.7% / 38.7% | 38.7% / 38.7% | 38.6% / 38.6% | 28.0% / 28.0% |
| P1M2C1 | 38.7% / 38.7% → 5.6% / 5.6% | 38.7% / 38.7% | 38.7% / 38.7% | 38.7% / 38.7% | 29.4% / 29.4% |
| P1M2C2 | 38.7% / 38.7% → 5.6% / 5.6% | 38.7% / 38.7% | 38.7% / 38.7% | 38.7% / 38.7% | 29.4% / 29.4% |
| P1M2C3 | 38.7% / 38.7% → 5.6% / 5.6% | 38.7% / 38.7% | 38.7% / 38.7% | 38.7% / 38.7% | 29.4% / 29.4% |
| P1M3C1 | 38.7% / 38.7% → 30.4% / 30.4% | 39.4% / 39.4% | 38.8% / 38.8% | 39.4% / 39.4% | 36.4% / 36.4% |
| P1M3C2 | 38.7% / 38.7% → 30.4% / 30.4% | 39.4% / 39.4% | 38.8% / 38.8% | 39.4% / 39.4% | 36.4% / 36.4% |
| P1M3C3 | 38.7% / 38.7% → 30.4% / 30.4% | 39.4% / 39.4% | 38.8% / 38.8% | 39.4% / 39.4% | 36.4% / 36.4% |
| P2M1C1 | 38.7% / 38.7% → 0.5% / 0.5% | 38.7% / 38.7% | 38.7% / 38.7% | 38.2% / 38.3% | 28.0% / 28.0% |
| P2M1C2 | 38.7% / 38.7% → 0.5% / 0.5% | 38.7% / 38.7% | 38.7% / 38.7% | 38.2% / 38.3% | 28.0% / 28.0% |
| P2M1C3 | 38.7% / 38.7% → 0.5% / 0.5% | 38.7% / 38.7% | 38.7% / 38.7% | 38.2% / 38.3% | 28.0% / 28.0% |
| P2M2C1 | 38.7% / 38.7% → 5.6% / 5.6% | 38.7% / 38.7% | 38.7% / 38.7% | 38.6% / 38.6% | 29.4% / 29.4% |
| P2M2C2 | 38.7% / 38.7% → 5.6% / 5.6% | 38.7% / 38.7% | 38.7% / 38.7% | 38.6% / 38.6% | 29.4% / 29.4% |
| P2M2C3 | 38.7% / 38.7% → 5.6% / 5.6% | 38.7% / 38.7% | 38.7% / 38.7% | 38.6% / 38.6% | 29.4% / 29.4% |
| P2M3C1 | 38.7% / 38.7% → 30.4% / 30.4% | 39.4% / 39.4% | 38.8% / 38.8% | 39.4% / 39.4% | 36.4% / 36.4% |
| P2M3C2 | 38.7% / 38.7% → 30.4% / 30.4% | 39.4% / 39.4% | 38.8% / 38.8% | 39.4% / 39.4% | 36.4% / 36.4% |
| P2M3C3 | 38.7% / 38.7% → 30.4% / 30.4% | 39.4% / 39.4% | 38.8% / 38.8% | 39.4% / 39.4% | 36.4% / 36.4% |
| P3M1C1 | 38.7% / 38.7% → 0.5% / 0.5% | 38.7% / 38.7% | 38.7% / 38.7% | 35.8% / 35.8% | 27.8% / 27.8% |
| P3M1C2 | 38.7% / 38.7% → 0.5% / 0.5% | 38.7% / 38.7% | 38.7% / 38.7% | 35.8% / 35.8% | 27.8% / 27.8% |
| P3M1C3 | 38.7% / 38.7% → 0.5% / 0.5% | 38.7% / 38.7% | 38.7% / 38.7% | 35.8% / 35.8% | 27.8% / 27.8% |
| P3M2C1 | 38.7% / 38.7% → 5.6% / 5.6% | 38.7% / 38.7% | 38.7% / 38.7% | 38.2% / 38.2% | 29.4% / 29.4% |
| P3M2C2 | 38.7% / 38.7% → 5.6% / 5.6% | 38.7% / 38.7% | 38.7% / 38.7% | 38.2% / 38.2% | 29.4% / 29.4% |
| P3M2C3 | 38.7% / 38.7% → 5.6% / 5.6% | 38.7% / 38.7% | 38.7% / 38.7% | 38.2% / 38.2% | 29.4% / 29.4% |
| P3M3C1 | 38.7% / 38.7% → 30.4% / 30.4% | 39.4% / 39.4% | 38.8% / 38.8% | 39.4% / 39.4% | 36.4% / 36.4% |
| P3M3C2 | 38.7% / 38.7% → 30.4% / 30.4% | 39.4% / 39.4% | 38.8% / 38.8% | 39.4% / 39.4% | 36.4% / 36.4% |
| P3M3C3 | 38.7% / 38.7% → 30.4% / 30.4% | 39.4% / 39.4% | 38.8% / 38.8% | 39.4% / 39.4% | 36.4% / 36.4% |
| R1 | 38.7% / 38.7% → 30.7% / 30.7% | 42.2% / 42.2% | 39.4% / 39.4% | 42.2% / 42.2% | 37.1% / 37.1% |
| R2 | 38.7% / 38.7% → 5.6% / 5.6% | 38.7% / 38.7% | 38.7% / 38.7% | 38.7% / 38.7% | 29.4% / 29.4% |
| Scenario | No-option gap old → expanded B′ / B | Old soft unmet B′ / B | Old request-first unmet B′ / B | Expanded soft unmet B′ / B | Expanded request-first unmet B′ / B |
|---|---|---|---|---|---|
| P1M1C1 | 3.4% / 3.4% → 0.1% / 0.1% | 30.9% / 30.9% | 25.7% / 25.7% | 31.2% / 31.2% | 24.7% / 24.7% |
| P1M1C2 | 8.7% / 8.7% → 0.1% / 0.1% | 35.2% / 35.2% | 28.6% / 28.6% | 31.4% / 31.4% | 24.8% / 24.8% |
| P1M1C3 | 33.1% / 33.1% → 0.2% / 0.2% | 46.3% / 46.3% | 39.2% / 39.2% | 31.4% / 31.4% | 24.8% / 24.8% |
| P1M2C1 | 16.4% / 16.4% → 1.6% / 1.6% | 35.8% / 35.9% | 31.3% / 31.3% | 32.4% / 32.4% | 25.4% / 25.4% |
| P1M2C2 | 19.8% / 19.8% → 1.8% / 1.8% | 37.7% / 37.7% | 32.9% / 32.9% | 32.8% / 32.8% | 25.6% / 25.6% |
| P1M2C3 | 35.2% / 35.2% → 2.7% / 2.7% | 42.2% / 42.2% | 38.8% / 38.9% | 32.9% / 33.0% | 25.9% / 25.9% |
| P1M3C1 | 36.7% / 36.7% → 20.9% / 20.9% | 39.2% / 39.2% | 38.4% / 38.4% | 38.0% / 38.0% | 33.0% / 33.0% |
| P1M3C2 | 37.0% / 37.0% → 21.5% / 21.5% | 39.0% / 39.0% | 38.4% / 38.4% | 38.5% / 38.5% | 33.3% / 33.3% |
| P1M3C3 | 38.3% / 38.3% → 24.6% / 24.6% | 39.0% / 39.0% | 38.7% / 38.7% | 38.9% / 38.9% | 34.5% / 34.5% |
| P2M1C1 | 3.4% / 3.4% → 0.1% / 0.1% | 27.4% / 27.4% | 24.9% / 24.9% | 28.6% / 28.6% | 24.2% / 24.2% |
| P2M1C2 | 8.7% / 8.7% → 0.1% / 0.1% | 32.3% / 32.3% | 28.1% / 28.1% | 29.3% / 29.3% | 24.3% / 24.3% |
| P2M1C3 | 33.1% / 33.1% → 0.2% / 0.2% | 47.2% / 47.2% | 40.6% / 40.6% | 29.4% / 29.4% | 24.3% / 24.3% |
| P2M2C1 | 16.4% / 16.4% → 1.6% / 1.6% | 34.4% / 34.4% | 31.3% / 31.3% | 30.6% / 30.7% | 25.2% / 25.2% |
| P2M2C2 | 19.8% / 19.8% → 1.8% / 1.8% | 36.7% / 36.7% | 33.1% / 33.1% | 31.0% / 31.0% | 25.2% / 25.2% |
| P2M2C3 | 35.2% / 35.2% → 2.7% / 2.7% | 43.3% / 43.3% | 39.9% / 39.9% | 31.2% / 31.2% | 25.5% / 25.5% |
| P2M3C1 | 36.7% / 36.7% → 20.9% / 20.9% | 39.7% / 39.7% | 38.9% / 38.9% | 37.4% / 37.4% | 33.0% / 33.0% |
| P2M3C2 | 37.0% / 37.0% → 21.5% / 21.5% | 39.5% / 39.5% | 38.9% / 38.9% | 38.0% / 38.0% | 33.2% / 33.2% |
| P2M3C3 | 38.3% / 38.3% → 24.6% / 24.6% | 39.4% / 39.4% | 39.0% / 39.0% | 38.5% / 38.4% | 34.6% / 34.6% |
| P3M1C1 | 3.4% / 3.4% → 0.1% / 0.1% | 24.7% / 24.8% | 23.9% / 23.9% | 26.2% / 26.2% | 23.2% / 23.2% |
| P3M1C2 | 8.7% / 8.7% → 0.1% / 0.1% | 30.2% / 30.2% | 27.5% / 27.5% | 28.8% / 28.8% | 23.3% / 23.3% |
| P3M1C3 | 33.1% / 33.1% → 0.2% / 0.2% | 50.8% / 50.8% | 43.1% / 43.1% | 31.6% / 31.6% | 23.5% / 23.5% |
| P3M2C1 | 16.4% / 16.4% → 1.6% / 1.6% | 33.9% / 33.9% | 31.6% / 31.6% | 30.4% / 30.4% | 24.2% / 24.2% |
| P3M2C2 | 19.8% / 19.8% → 1.8% / 1.8% | 36.9% / 36.9% | 34.0% / 34.0% | 31.4% / 31.4% | 24.3% / 24.3% |
| P3M2C3 | 35.2% / 35.2% → 2.7% / 2.7% | 47.0% / 47.0% | 42.5% / 42.5% | 31.4% / 31.4% | 24.7% / 24.7% |
| P3M3C1 | 36.7% / 36.7% → 20.9% / 20.9% | 41.7% / 41.7% | 40.3% / 40.3% | 38.7% / 38.7% | 33.1% / 33.1% |
| P3M3C2 | 37.0% / 37.0% → 21.5% / 21.5% | 41.2% / 41.2% | 40.2% / 40.2% | 39.1% / 39.2% | 33.4% / 33.4% |
| P3M3C3 | 38.3% / 38.3% → 24.6% / 24.6% | 40.8% / 40.8% | 40.1% / 40.1% | 39.1% / 39.1% | 34.8% / 34.8% |
| R1 | 37.1% / 37.1% → 21.9% / 21.9% | 38.6% / 38.6% | 38.2% / 38.2% | 38.7% / 38.7% | 34.0% / 34.0% |
| R2 | 27.5% / 27.5% → 2.3% / 2.3% | 42.3% / 42.3% | 37.8% / 37.8% | 33.7% / 33.7% | 26.3% / 26.3% |
| Task / world / rule | Different choices per scenario | Unmet difference B − B′ |
|---|---|---|
| C1 / basic / soft | 0–49 / 30,000 | -0.004 to +0.079 pp |
| C1 / basic / request first | 0–11 / 30,000 | +0.000 to +0.019 pp |
| C1 / fixed_plus5 / soft | 0–49 / 30,000 | -0.004 to +0.079 pp |
| C1 / fixed_plus5 / request first | 0–11 / 30,000 | +0.000 to +0.019 pp |
| F1b / basic / soft | 0–25 / 30,000 | -0.017 to +0.034 pp |
| F1b / basic / request first | 0–19 / 30,000 | -0.011 to +0.010 pp |
| F1b / fixed_plus5 / soft | 0–25 / 30,000 | -0.017 to +0.034 pp |
| F1b / fixed_plus5 / request first | 0–19 / 30,000 | -0.011 to +0.010 pp |
These are paired counterfactual instance differences, not measured satisfaction or a demonstrated curved-boundary advantage. Only matched passing actions are included in the primary policy comparison. The offered destination IDs match. The sole excluded seat failed all 24 choices in both layouts. For passing candidates, the search stops at the first shared pass; it does not exhaust later choices to establish absence of layout-specific choreographies.
The study now connects a specified unmet condition to an additional verified destination, then tests the consequence of a different choice rule using the same users. Remaining gaps require either another reachable condition or better information about the user's request. More classifier training alone cannot make an unverified seat available.
This uses the existing 874-person rating pool and 30,000 resampled instances, not new human participants. Rates average each person's instances before averaging people equally and depend on the odor mix and synthetic thresholds. Data: Bierling et al. (2025), olfactory perception dataset v3, CC BY 4.0. Only aggregate results are published. Native Rhino files, detailed private trajectories, respondent rows and trained model files remain private.
PREVIOUS V2 / PREFERENCE DIVERSITY + UNMET CONDITIONS / 30 OCT 2026
29 declared scenarios vary scent preference importance, movement burden and desire for company. The same 30,000 virtual instances are replayed in B′72 and B72. They reuse ratings from 874 source respondents; the behavioural traits and desired-condition thresholds are synthetic.
C1: the nearby move preserves all three sightlines, but its roughly 4% reduction in the stationary tracer index cannot meet a 10% reduction request. F1b: for instances requesting a reduction (ratings below 35), the longer move offers roughly 37% reduction, but high movement burden or a request to retain all three peer sightlines can leave no qualifying choice.
“Suitable” here means meeting tracer, contact and burden thresholds. Withdrawal is a soft preference and is excluded from these thresholds: staying can count as met despite a strong wish to step back. These are conditional instance outcomes, not the share of real people dissatisfied. The tracer index is not measured scent exposure. C1 and F1b have different origins.
Primary need thresholds, P2M2C2. Each cell is B′72 / B72. Occupancy is not an explicit choice-model feature. The previously verified route, tracer and sightline inputs happen to be identical for the basic and plus-five-target-occupant contexts, so their choice results are duplicate evaluations, not independent evidence of an occupancy effect. Percentages average each source person's instances first, then weight the 874 people equally.
| Origin task | No qualifying action | Avoidable miss / direct | Total unmet / direct | Total unmet / tree |
|---|---|---|---|---|
| C1 | 38.7% / 38.7% | 0.0% / 0.0% | 38.7% / 38.7% | 38.7% / 38.7% |
| F1b | 19.8% / 19.8% | 16.9% / 16.9% | 36.7% / 36.7% | 36.7% / 36.7% |
No qualifying action: neither stay nor the one verified move meets every requested condition. Avoidable miss: a qualifying action exists but the policy chooses another. Total unmet is their sum. “Avoidable” is relative to these thresholds; it is not automatically a utility error. The two policies optimise compensating gains and losses rather than enforcing every threshold. An avoidable miss may therefore be a move the declared utility prefers. The C1 38.7% is the person-weighted share of resampled low-rated odor instances; it depends on the odor mix, and is not 38.7% of people.
Primary thresholds and base traits; B′72. Counts are source people with at least one qualifying instance / bootstrap instances in that group. Synthetic traits belong to instances; they do not describe fixed traits of the original respondents. Rows overlap and must not be added. Within a group, each represented person is weighted equally; this differs from dividing the instance count by 30,000.
| Task / evaluation group | People / instances | No qualifying action | Direct unmet | Tree unmet |
|---|---|---|---|---|
| C1 / Rating below 35 | 819 / 11,704 | 100.0% | 100.0% | 100.0% |
| C1 / Rating 35–65 | 793 / 9,582 | 0.0% | 0.0% | 0.0% |
| C1 / Rating above 65 | 779 / 8,714 | 0.0% | 0.0% | 0.0% |
| C1 / Below 35 + movement weight ≥4 | 614 / 1,426 | 100.0% | 100.0% | 100.0% |
| C1 / Below 35 + company weight >9 | 667 / 1,779 | 100.0% | 100.0% | 100.0% |
| C1 / Below 35 + both high traits | 193 / 218 | 100.0% | 100.0% | 100.0% |
| F1b / Rating below 35 | 819 / 11,704 | 51.8% | 77.1% | 82.1% |
| F1b / Rating 35–65 | 793 / 9,582 | 0.0% | 6.8% | 3.8% |
| F1b / Rating above 65 | 779 / 8,714 | 0.0% | 16.5% | 13.4% |
| F1b / Below 35 + movement weight ≥4 | 614 / 1,426 | 100.0% | 100.0% | 100.0% |
| F1b / Below 35 + company weight >9 | 667 / 1,779 | 100.0% | 100.0% | 100.0% |
| F1b / Below 35 + both high traits | 193 / 218 | 100.0% | 100.0% | 100.0% |
Under the primary assumptions, every below-35 instance at C1 lacks a qualifying action. At F1b, that is also true for the below-35 instances with movement weight ≥4 or company weight >9. By contrast, a neutral or favourable rating always has a qualifying stay option; its unmet outcome can only be a policy miss. Withdrawal demand can still make a move attractive in the utility calculation.
This is a within-mixture evaluation, not a held-out-scenario or distribution-shift test. Five new depth-5 trees were fitted with unchanged source-person outer splits and fresh inner three-fold preference predictions. All copies of a source person stay together. One seeded assignment from the 29 scenarios supplies each training instance's traits; every held-out instance is then tested in all 29 scenarios. The direct rule and tree both receive predicted pleasantness, scent salience, withdrawal need, shared-surface weight, company weight, movement weight, stationary ratio, retained sightline fraction and pelvis-trace index. Observed target ratings are used only for training labels and held-out evaluation, never as prediction features.
The direct rule has lower mean utility loss in 57/58 task–scenario comparisons in each layout. Occupancy repeats the same numerical inputs. The exception is R1 at F1b in both layouts: B′ tree loss is 0.033965 versus 0.034335 for the direct rule (B: 0.033659 versus 0.034032). The roughly 0.0004-unit reversal is compatible with approximation smoothing of noisy preference predictions; it does not establish a structural learning advantage. Lower utility loss does not guarantee fewer unmet conditions.
| Base context / policy | Total unmet | Avoidable miss | Utility loss | Rule agreement |
|---|---|---|---|---|
| C1 / Direct preference rule | 38.7% | 0.0% | 0.030 | 95.4% |
| C1 / New V2 tree | 38.7% | 0.0% | 0.105 | 91.8% |
| C1 / Always stay | 38.7% | 0.0% | 3.937 | 39.6% |
| C1 / Always move | 38.8% | 0.1% | 1.822 | 60.4% |
| C1 / Observed-rating utility reference | 38.7% | 0.0% | 0.000 | 100.0% |
| F1b / Direct preference rule | 36.7% | 16.9% | 1.520 | 76.4% |
| F1b / New V2 tree | 36.7% | 16.9% | 2.079 | 72.6% |
| F1b / Always stay | 38.7% | 18.8% | 2.846 | 67.1% |
| F1b / Always move | 65.8% | 46.0% | 10.340 | 32.9% |
| F1b / Observed-rating utility reference | 24.2% | 4.4% | 0.000 | 100.0% |
Table: B′ basic, P2M2C2. Agreement is with the synthetic observed-rating utility reference, not human behaviour; loss is in arbitrary utility units. Even that reference can leave avoidable unmet conditions because soft utility allows trade-offs. Always stay can avoid some threshold violations while sacrificing withdrawal utility.
In the base F1b case, the worst decile of source-person mean unmet rates is 65.9% for the direct rule and 69.3% for the tree. At least one instance is unmet for 868/874 and 862/874 source people respectively. These counts describe repeated odor instances, not people consistently dissatisfied. Both C1 methods have a worst-decile rate of 80.6% and 819/874 people with at least one unmet instance.
P1/P2/P3 multiply the scent-rating contribution by 0.5 / 1 / 2; ratings themselves are unchanged. M1/M2/M3 multiply movement weight by 0.5 / 1 / 3. C1/C2/C3 in scenario IDs multiply company weight by 0.25 / 1 / 3; these C codes are trait levels, not the C1 route name. The full 3 × 3 × 3 grid is reported below. R1 couples high withdrawal demand with high movement burden through a shared rank. R2 mixes low-demand and high-demand groups with positively correlated company and withdrawal needs.
Seed 20261031. Base withdrawal need ~ Uniform(0,20); independent shared-surface and company weights ~ 12 × Beta(2,2); movement weight ~ Lognormal(log 2,0.6). The same draws, ratings, scenario transforms, folds and policies are paired across layouts. R1 uses a threefold movement distribution sorted by the withdrawal rank. R2 has equal-probability low and high groups: withdrawal 0–4 / 16–20; company 0–3 / 24–36, using the same within-group rank.
move gain = salience × (pleasantness − 50) × (ratio − 1) + withdrawal − shared-surface weight + company × (retained sightline fraction − 1) − movement weight × pelvis-trace index
Company contributes positively to both stay and move; the move gain subtracts the lost fraction. Same-surface priority is a separate term. Stay retains three origin peers with no travel burden. The complete pelvis traces are 8.563 m (C1) and 45.278 m (F1b); division by 10 defines a burden index including posture and chair handling, not walking distance or time. Ties stay. Fixed γ = 1; no parameter tuning on held-out results.
Primary: ratings below 35 request at least 10% reduction of the stationary tracer index; ratings above 65 request at least 90% retention; ratings 35–65 impose no tracer target. Company weight ≤3 requests zero peer rays, ≤9 requests two, and >9 requests three. Movement weight × trace index must be ≤10. These conditions must all hold. Withdrawal remains a soft preference, not a minimum requirement.
Lenient sensitivity changes the reduction request to 2%, retention to 70%, burden ceiling to 20 and contact request to one fewer peer (minimum zero). Strict sensitivity uses 25%, 98%, 5 and one extra peer (maximum three). These are joint threshold packages, so their effects cannot be attributed to one threshold alone. All are invented testing assumptions, not standards for comfort, health or accessibility.
| Task / need package | No-action gap across all 29 scenarios | Direct unmet across all 29 scenarios |
|---|---|---|
| C1 / lenient | 0.0%–0.4% | 12.0%–25.0% |
| C1 / primary | 38.7%–38.7% | 38.7%–42.2% |
| C1 / strict | 38.7%–38.7% | 54.3%–57.7% |
| F1b / lenient | 0.3%–27.1% | 22.6%–38.6% |
| F1b / primary | 3.4%–38.3% | 24.7%–50.8% |
| F1b / strict | 16.4%–38.7% | 38.5%–59.1% |
The C1 opportunity gap almost disappears under the lenient package, showing why the 10% request must be stated with the result. The headline conclusion is conditional on the requested reduction, not a universal failure of C1.
Every declared scenario is retained, including the two correlated cases. Values are B′ / B. Basic and occupied results are identical; the displayed results represent both, not extra independent evidence. Utility losses are rounded to three decimals; R1's small reversal is retained in the text above. No average over these arbitrarily weighted scenarios is presented as a population estimate.
| Scenario | No qualifying action B′ / B | Direct unmet B′ / B | Tree unmet B′ / B | Direct loss B′ / B | Tree loss B′ / B |
|---|---|---|---|---|---|
| P1M1C1 | 38.7% / 38.7% | 38.7% / 38.7% | 38.7% / 38.7% | 0.007 / 0.007 | 0.076 / 0.076 |
| P1M1C2 | 38.7% / 38.7% | 38.7% / 38.7% | 38.7% / 38.7% | 0.007 / 0.007 | 0.076 / 0.076 |
| P1M1C3 | 38.7% / 38.7% | 38.7% / 38.7% | 38.7% / 38.7% | 0.007 / 0.007 | 0.076 / 0.076 |
| P1M2C1 | 38.7% / 38.7% | 38.7% / 38.7% | 38.7% / 38.7% | 0.008 / 0.008 | 0.077 / 0.077 |
| P1M2C2 | 38.7% / 38.7% | 38.7% / 38.7% | 38.7% / 38.7% | 0.008 / 0.008 | 0.077 / 0.077 |
| P1M2C3 | 38.7% / 38.7% | 38.7% / 38.7% | 38.7% / 38.7% | 0.008 / 0.008 | 0.077 / 0.077 |
| P1M3C1 | 38.7% / 38.7% | 39.4% / 39.4% | 40.6% / 40.6% | 0.006 / 0.006 | 0.252 / 0.252 |
| P1M3C2 | 38.7% / 38.7% | 39.4% / 39.4% | 40.6% / 40.6% | 0.006 / 0.006 | 0.252 / 0.252 |
| P1M3C3 | 38.7% / 38.7% | 39.4% / 39.4% | 40.6% / 40.6% | 0.006 / 0.006 | 0.252 / 0.252 |
| P2M1C1 | 38.7% / 38.7% | 38.7% / 38.7% | 38.7% / 38.7% | 0.030 / 0.029 | 0.104 / 0.104 |
| P2M1C2 | 38.7% / 38.7% | 38.7% / 38.7% | 38.7% / 38.7% | 0.030 / 0.029 | 0.104 / 0.104 |
| P2M1C3 | 38.7% / 38.7% | 38.7% / 38.7% | 38.7% / 38.7% | 0.030 / 0.029 | 0.104 / 0.104 |
| P2M2C1 | 38.7% / 38.7% | 38.7% / 38.7% | 38.7% / 38.7% | 0.030 / 0.030 | 0.105 / 0.105 |
| P2M2C2 | 38.7% / 38.7% | 38.7% / 38.7% | 38.7% / 38.7% | 0.030 / 0.030 | 0.105 / 0.105 |
| P2M2C3 | 38.7% / 38.7% | 38.7% / 38.7% | 38.7% / 38.7% | 0.030 / 0.030 | 0.105 / 0.105 |
| P2M3C1 | 38.7% / 38.7% | 39.4% / 39.4% | 40.6% / 40.6% | 0.024 / 0.024 | 0.274 / 0.274 |
| P2M3C2 | 38.7% / 38.7% | 39.4% / 39.4% | 40.6% / 40.6% | 0.024 / 0.024 | 0.274 / 0.274 |
| P2M3C3 | 38.7% / 38.7% | 39.4% / 39.4% | 40.6% / 40.6% | 0.024 / 0.024 | 0.274 / 0.274 |
| P3M1C1 | 38.7% / 38.7% | 38.7% / 38.7% | 38.7% / 38.7% | 0.115 / 0.114 | 0.213 / 0.212 |
| P3M1C2 | 38.7% / 38.7% | 38.7% / 38.7% | 38.7% / 38.7% | 0.115 / 0.114 | 0.213 / 0.212 |
| P3M1C3 | 38.7% / 38.7% | 38.7% / 38.7% | 38.7% / 38.7% | 0.115 / 0.114 | 0.213 / 0.212 |
| P3M2C1 | 38.7% / 38.7% | 38.7% / 38.7% | 38.7% / 38.7% | 0.113 / 0.112 | 0.210 / 0.209 |
| P3M2C2 | 38.7% / 38.7% | 38.7% / 38.7% | 38.7% / 38.7% | 0.113 / 0.112 | 0.210 / 0.209 |
| P3M2C3 | 38.7% / 38.7% | 38.7% / 38.7% | 38.7% / 38.7% | 0.113 / 0.112 | 0.210 / 0.209 |
| P3M3C1 | 38.7% / 38.7% | 39.4% / 39.4% | 40.6% / 40.6% | 0.099 / 0.098 | 0.366 / 0.365 |
| P3M3C2 | 38.7% / 38.7% | 39.4% / 39.4% | 40.6% / 40.6% | 0.099 / 0.098 | 0.366 / 0.365 |
| P3M3C3 | 38.7% / 38.7% | 39.4% / 39.4% | 40.6% / 40.6% | 0.099 / 0.098 | 0.366 / 0.365 |
| R1 / withdrawal + burden | 38.7% / 38.7% | 42.2% / 42.2% | 43.2% / 43.2% | 0.046 / 0.046 | 0.321 / 0.320 |
| R2 / company + withdrawal | 38.7% / 38.7% | 38.7% / 38.7% | 38.7% / 38.7% | 0.008 / 0.008 | 0.026 / 0.026 |
| Scenario | No qualifying action B′ / B | Direct unmet B′ / B | Tree unmet B′ / B | Direct loss B′ / B | Tree loss B′ / B |
|---|---|---|---|---|---|
| P1M1C1 | 3.4% / 3.4% | 30.9% / 30.9% | 30.1% / 30.1% | 0.585 / 0.583 | 1.342 / 1.341 |
| P1M1C2 | 8.7% / 8.7% | 35.2% / 35.2% | 34.2% / 34.2% | 0.567 / 0.566 | 1.225 / 1.224 |
| P1M1C3 | 33.1% / 33.1% | 46.3% / 46.3% | 52.4% / 52.4% | 0.451 / 0.451 | 1.401 / 1.400 |
| P1M2C1 | 16.4% / 16.4% | 35.8% / 35.9% | 34.5% / 34.5% | 0.457 / 0.456 | 0.997 / 0.996 |
| P1M2C2 | 19.8% / 19.8% | 37.7% / 37.7% | 36.7% / 36.7% | 0.412 / 0.411 | 0.898 / 0.898 |
| P1M2C3 | 35.2% / 35.2% | 42.2% / 42.2% | 46.5% / 46.5% | 0.282 / 0.282 | 0.996 / 0.996 |
| P1M3C1 | 36.7% / 36.7% | 39.2% / 39.2% | 38.6% / 38.6% | 0.095 / 0.095 | 0.187 / 0.187 |
| P1M3C2 | 37.0% / 37.0% | 39.0% / 39.0% | 38.8% / 38.8% | 0.076 / 0.076 | 0.149 / 0.149 |
| P1M3C3 | 38.3% / 38.3% | 39.0% / 39.0% | 39.3% / 39.3% | 0.035 / 0.035 | 0.123 / 0.123 |
| P2M1C1 | 3.4% / 3.4% | 27.4% / 27.4% | 30.1% / 30.1% | 1.968 / 1.964 | 2.803 / 2.799 |
| P2M1C2 | 8.7% / 8.7% | 32.3% / 32.3% | 34.2% / 34.2% | 1.914 / 1.913 | 2.604 / 2.600 |
| P2M1C3 | 33.1% / 33.1% | 47.2% / 47.2% | 52.4% / 52.4% | 1.639 / 1.637 | 2.418 / 2.415 |
| P2M2C1 | 16.4% / 16.4% | 34.4% / 34.4% | 34.5% / 34.5% | 1.623 / 1.620 | 2.307 / 2.303 |
| P2M2C2 | 19.8% / 19.8% | 36.7% / 36.7% | 36.7% / 36.7% | 1.520 / 1.517 | 2.079 / 2.075 |
| P2M2C3 | 35.2% / 35.2% | 43.3% / 43.3% | 46.5% / 46.5% | 1.146 / 1.144 | 1.774 / 1.772 |
| P2M3C1 | 36.7% / 36.7% | 39.7% / 39.7% | 38.6% / 38.6% | 0.470 / 0.469 | 0.605 / 0.603 |
| P2M3C2 | 37.0% / 37.0% | 39.5% / 39.5% | 38.8% / 38.8% | 0.402 / 0.401 | 0.494 / 0.493 |
| P2M3C3 | 38.3% / 38.3% | 39.4% / 39.4% | 39.3% / 39.3% | 0.233 / 0.233 | 0.315 / 0.314 |
| P3M1C1 | 3.4% / 3.4% | 24.7% / 24.8% | 30.1% / 30.1% | 5.115 / 5.108 | 6.620 / 6.611 |
| P3M1C2 | 8.7% / 8.7% | 30.2% / 30.2% | 34.2% / 34.2% | 5.049 / 5.039 | 6.364 / 6.355 |
| P3M1C3 | 33.1% / 33.1% | 50.8% / 50.8% | 52.4% / 52.4% | 4.865 / 4.859 | 5.863 / 5.854 |
| P3M2C1 | 16.4% / 16.4% | 33.9% / 33.9% | 34.5% / 34.5% | 4.693 / 4.687 | 6.224 / 6.214 |
| P3M2C2 | 19.8% / 19.8% | 36.9% / 36.9% | 36.7% / 36.7% | 4.652 / 4.645 | 5.856 / 5.847 |
| P3M2C3 | 35.2% / 35.2% | 47.0% / 47.0% | 46.5% / 46.5% | 4.139 / 4.132 | 5.053 / 5.044 |
| P3M3C1 | 36.7% / 36.7% | 41.7% / 41.7% | 38.6% / 38.6% | 2.321 / 2.315 | 2.729 / 2.723 |
| P3M3C2 | 37.0% / 37.0% | 41.2% / 41.2% | 38.8% / 38.8% | 2.109 / 2.102 | 2.442 / 2.436 |
| P3M3C3 | 38.3% / 38.3% | 40.8% / 40.8% | 39.3% / 39.3% | 1.637 / 1.633 | 1.805 / 1.800 |
| R1 / withdrawal + burden | 37.1% / 37.1% | 38.6% / 38.6% | 38.7% / 38.7% | 0.034 / 0.034 | 0.034 / 0.034 |
| R2 / company + withdrawal | 27.5% / 27.5% | 42.3% / 42.3% | 47.3% / 47.3% | 1.279 / 1.276 | 1.675 / 1.672 |
| Task / policy | Different actions per scenario | Unmet difference B − B′, range |
|---|---|---|
| C1 / Direct preference rule | 0–6 / 30,000 | +0.0000 to +0.0000 pp |
| C1 / New V2 tree | 0–0 / 30,000 | +0.0000 to +0.0000 pp |
| F1b / Direct preference rule | 0–13 / 30,000 | -0.0154 to +0.0141 pp |
| F1b / New V2 tree | 0–0 / 30,000 | +0.0000 to +0.0000 pp |
Every paired tree input reaches the same leaf, so there are zero learned-action differences at this model resolution. The direct rule sometimes crosses zero gain because of the small retained tracer-ratio difference. This does not establish a boundary-shape benefit. At most 0.147% of evaluated rows by person-equal weight have any feature outside their own training-fold range; this is a coverage diagnostic, not proof of generalisation.
The 58 task–scenario configurations are evaluated in two layouts and two occupancy labels. Their 6.96 million counterfactual replays include exact occupancy duplicates; they add no new people, new geometric motion checks or simultaneous crowd simulation. C1 offers stay or T4/S6 → T5/S4 → T4/S6; F1b offers stay or T2/S4 → T6/S3 → T2/S4. No failed detour or unverified destination is offered. D1 transport, D2 ducts, F1b furniture and all 72 seats remain unchanged.
The next useful simulation is to seek an additional reachable option at each origin that reduces the identified opportunity gap, and compare an explicit requested-condition rule with the current soft-utility rule. A new destination must first pass its own full return cycle. More training alone cannot create a missing action.
Ratings: Bierling et al. (2025), A dataset of laymen olfactory perception for 74 monomolecular odors, v3, CC BY 4.0. This project adds the resampling, synthetic traits and spatial utility. Public pages contain aggregate results only; respondent records, trained models and native Rhino originals remain private.
PREVIOUS V1a / EMPIRICAL RATINGS + SYNTHETIC CHOICE LEARNING
The existing 30,000 empirical-bootstrap instances come from 874 source respondents. Their scent pleasantness ratings are observed data; withdrawal need, shared-task priority and movement cost are new random assumptions. Each replay has one moving virtual user, fixed background occupants, a vacant destination and a reserved origin. This is not a 30,000-person crowd simulation or 30,000 independent participants.
Result: 15 shallow choice trees were trained: five source-person folds × three response-mapping assumptions. The direct predicted-preference rule has lower primary simulated loss than the learned tree in all eight layout/task/occupancy contexts. Both layouts produce identical learned choices under every tested mapping. The learned model is an inspected benchmark, not a replacement justified by these results.
Data source: Bierling, Croy, Jesgarzewsky, Rommel, Cuniberti, Hummel & Croy (2025), A dataset of laymen olfactory perception for 74 monomolecular odors, v3, CC BY 4.0. This project filters and resamples the ratings and adds its own synthetic behavioural rules; the authors did not report these spatial results.
C1: T4/S6 → T5/S4 → T4/S6, or stay. The accepted C2 route remains the available move because no new C3 detour completes. F1b: T2/S4 → T6/S3 → T2/S4, or stay, using its separately verified basic and occupied cycles. The F1b destination is never offered to a C1-origin agent. No untested seat or failed C3 path enters the action set.
The complete pelvis trace is 8.563 m for C1 and 45.278 m for F1b, including posture and chair handling. Dividing by 10 produces a declared movement-cost index, not walking distance, duration or measured effort. Stationary maximum AUC ratios are approximately 0.962 and 0.630 respectively. V1a uses the current F1b reselected metrics at the moved furniture coordinates; the earlier 0.628 value retained in the original case is not used in this learning run. This is corrected input selection, not a new transport solve. They do not measure exposure during movement and are not specific scent identities or perceived concentrations.
| Exact sightline condition | B′72 | B72 |
|---|---|---|
| C1 / Basic | 3/3 | 3/3 |
| C1 / Plus five target occupants | 3/3 | 3/3 |
| F1b / Basic | 2/3 | 2/3 |
| F1b / Plus five target occupants | 2/3 | 2/3 |
Fresh preference predictions use training-person odour means plus two known calibration ratings (Benzyl/Decan) with a fixed shrinkage of five. Each choice model receives only predicted pleasantness, the three synthetic traits, and action attributes. The target is the choice made by the declared utility rule using the observed rating. No measured spatial-choice labels exist. The choice trees use depth 5 and a minimum of 200 replay rows per leaf, fixed before training.
All duplicates of a source person remain in one outer fold. Preference inputs for training the choice model are generated by a separate three-fold cross-fit inside that outer training set; held-out targets never fit either stage. The older global out-of-fold predictions are not reused. No hyperparameters were selected using the test folds. This remains exploratory reuse of a previously studied respondent pool, not a fresh external cohort.
Matched occupancy correction: V1a recalculates reciprocal sightline status from current geometry using exactly the three origin peers, the mover at the destination and, in the occupied condition, the five target occupants. The earlier full-room-occupancy proxy is excluded. V1 results are retained privately as a superseded provenance baseline. The same utility, random seed, folds and learner parameters are retained.
move gain = (pleasantness − 50) × (maximum stationary relative AUC^γ − 1) + withdrawal need − shared-task weight × (1 + visual-pair loss) − movement weight × pelvis-trace index
Move only when gain > 0 and the route is verified; ties stay. Withdrawal need ~ Uniform(0,20), shared-task weight ~ 12 × Beta(2,2), movement weight ~ Lognormal(log 2, 0.6). Seed 20261030. γ = 0.5, 1 and 2 are sensitivity assumptions. The same ratings, random draws, folds and rules are paired across both layouts. Every move receives a withdrawal benefit and a shared-work-surface penalty, including C1 when it retains all three visual pairs. C1 moves to a different table: visual contact does not remove the declared same-surface penalty. This is one scenario assumption, not a learned fact about nearby contact. Shared-work loss and geometric sightline loss are assumed penalties, not measured sociability or conversation.
Agreement is with the declared rule's reference action, not observed human behaviour. Loss (regret) is reference utility minus achieved utility, in arbitrary model units. Each source person is equally weighted. Worst decile means the 10% of source people with the greatest mean loss. The reference itself has 100% agreement and zero loss by definition.
| Context | Method | B′ agreement | B agreement | Mean loss B′ / B | Worst-decile loss B′ / B | Move B′ / B |
|---|---|---|---|---|---|---|
| C1 / Basic | Always stay | 39.8% | 39.8% | 3.912 / 3.912 | 5.385 / 5.383 | 0.0% / 0.0% |
| C1 / Basic | Always move | 60.2% | 60.2% | 1.812 / 1.812 | 2.811 / 2.811 | 100.0% / 100.0% |
| C1 / Basic | Training majority | 39.8% | 39.8% | 3.912 / 3.912 | 5.385 / 5.383 | 0.0% / 0.0% |
| C1 / Basic | Direct predicted-preference rule | 95.6% | 95.6% | 0.027 / 0.027 | 0.098 / 0.098 | 60.4% / 60.4% |
| C1 / Basic | Learned tree | 91.9% | 91.9% | 0.104 / 0.104 | 0.290 / 0.289 | 59.9% / 59.9% |
| C1 / Occupied | Always stay | 39.8% | 39.8% | 3.912 / 3.912 | 5.385 / 5.383 | 0.0% / 0.0% |
| C1 / Occupied | Always move | 60.2% | 60.2% | 1.812 / 1.812 | 2.811 / 2.811 | 100.0% / 100.0% |
| C1 / Occupied | Training majority | 39.8% | 39.8% | 3.912 / 3.912 | 5.385 / 5.383 | 0.0% / 0.0% |
| C1 / Occupied | Direct predicted-preference rule | 95.6% | 95.6% | 0.027 / 0.027 | 0.098 / 0.098 | 60.4% / 60.4% |
| C1 / Occupied | Learned tree | 91.9% | 91.9% | 0.104 / 0.104 | 0.290 / 0.289 | 59.9% / 59.9% |
| F1b / Basic | Always stay | 67.3% | 67.3% | 2.850 / 2.846 | 6.632 / 6.622 | 0.0% / 0.0% |
| F1b / Basic | Always move | 32.7% | 32.7% | 10.390 / 10.387 | 18.345 / 18.335 | 100.0% / 100.0% |
| F1b / Basic | Training majority | 67.3% | 67.3% | 2.850 / 2.846 | 6.632 / 6.622 | 0.0% / 0.0% |
| F1b / Basic | Direct predicted-preference rule | 76.3% | 76.3% | 1.525 / 1.521 | 3.900 / 3.891 | 25.7% / 25.7% |
| F1b / Basic | Learned tree | 72.7% | 72.7% | 2.084 / 2.081 | 4.633 / 4.627 | 24.5% / 24.5% |
| F1b / Occupied | Always stay | 67.3% | 67.3% | 2.850 / 2.846 | 6.632 / 6.622 | 0.0% / 0.0% |
| F1b / Occupied | Always move | 32.7% | 32.7% | 10.390 / 10.387 | 18.345 / 18.335 | 100.0% / 100.0% |
| F1b / Occupied | Training majority | 67.3% | 67.3% | 2.850 / 2.846 | 6.632 / 6.622 | 0.0% / 0.0% |
| F1b / Occupied | Direct predicted-preference rule | 76.3% | 76.3% | 1.525 / 1.521 | 3.900 / 3.891 | 25.7% / 25.7% |
| F1b / Occupied | Learned tree | 72.7% | 72.7% | 2.084 / 2.081 | 4.633 / 4.627 | 24.5% / 24.5% |
Groups use the original observed rating solely for evaluation. People can contribute to more than one group through different odour ratings; these counts must not be added as distinct people.
| Context | Rating group | Source people | Learned agreement | Mean loss | Move rate |
|---|---|---|---|---|---|
| C1 | rated below 35 | 819 | 91.6% | 0.111 | 59.9% |
| C1 | rated 35 to 65 | 793 | 93.6% | 0.080 | 59.6% |
| C1 | rated above 65 | 779 | 91.2% | 0.112 | 59.8% |
| F1b | rated below 35 | 819 | 60.9% | 2.793 | 30.6% |
| F1b | rated 35 to 65 | 793 | 78.0% | 1.120 | 24.9% |
| F1b | rated above 65 | 779 | 83.5% | 2.079 | 17.0% |
| γ | Context | Learned agreement | Learned mean loss | Direct-rule mean loss |
|---|---|---|---|---|
| 0.5 | C1 / basic | 93.6% | 0.074 | 0.006 |
| 0.5 | F1b / basic | 81.1% | 0.853 | 0.515 |
| 1 | C1 / basic | 91.9% | 0.104 | 0.027 |
| 1 | F1b / basic | 72.7% | 2.084 | 1.525 |
| 2 | C1 / basic | 88.4% | 0.207 | 0.107 |
| 2 | F1b / basic | 66.8% | 4.195 | 3.459 |
| Context | Different actions | Loss difference B − B′ | Descriptive 95% interval |
|---|---|---|---|
| C1 / basic | 0 / 30,000 | -0.00022 | -0.00023 to -0.00020 |
| C1 / occupied | 0 / 30,000 | -0.00022 | -0.00023 to -0.00020 |
| F1b / basic | 0 / 30,000 | -0.00306 | -0.00321 to -0.00292 |
| F1b / occupied | 0 / 30,000 | -0.00306 | -0.00321 to -0.00292 |
Intervals resample source people 1,000 times and are conditional on the fitted folds and declared utility assumptions. They exclude transport, preference-mapping and behaviour-model uncertainty. All paired users reach the same tree leaf in each fitted fold: the tiny layout-input differences do not cross these trees' learned thresholds. Identical learned actions therefore reflect this model's resolution and inputs, not equivalence of the layouts. The tiny score differences do not establish a curved-boundary benefit. Neither model agreement nor Claude review validates real comfort, preference, access or scent experience.
Checks include source separation, inner cross-fitting, held-out-target perturbation invariance, identical paired route/trait inputs, and frozen input hashes. Raw records, source identifiers, learned model files and native Rhino originals remain private. Only aggregate results are published here.
C3 / MATCHED LOCAL DETOURS / 30 OCT 2026
All 16 predeclared alternatives were run in both B′72 and B72, with three stationary origin peers and with five additional target occupants: 64 full-cycle attempts. None completes. The original two C2 passing choices are retained; C3 is a separate experiment and does not change the C2 2/24 census.
Eight destination-entry plans declare different forward offsets, side offsets and 30° turns; all fail on the shared pad-to-rear-corner segment before reaching their forward-offset or yaw changes. The four origin plans fail before reaching their declared lateral endpoints. Four grip approaches use a rear corridor. Thus 16 declared attempts are not 16 distinct evaluated path geometries. All keep the original release-pad route, 300 mm chair pull, nominal 20-part body and F1b furniture. Grip-side labels describe standing position; the right-hand grip chain remains unchanged.
Destination-entry plans meet the destination chair shell. Origin plans meet the neighbouring chair shell or table base. Rear grip detours reach a boundary panel or neighbouring sled rail. Failed attempts stop at the first collision; later entry, reset or return stages are not treated as tested. A failure is not proof that no other path exists.
| ID | Family | Declared change | B′ basic / occupied | B basic / occupied | B′ first collision | B first collision |
|---|---|---|---|---|---|---|
| D01 | destination entry | advance 150 mm; side 550 mm; yaw -30° | Blocked / blocked | Blocked / blocked | S5 destination seat and push / kneeL / B_Activity_5_S4/Folded_seat_shell | S5 destination seat and push / kneeL / B_Activity_5_S4/Folded_seat_shell |
| D02 | destination entry | advance 150 mm; side 550 mm; yaw +30° | Blocked / blocked | Blocked / blocked | S5 destination seat and push / kneeL / B_Activity_5_S4/Folded_seat_shell | S5 destination seat and push / kneeL / B_Activity_5_S4/Folded_seat_shell |
| D03 | destination entry | advance 300 mm; side 550 mm; yaw -30° | Blocked / blocked | Blocked / blocked | S5 destination seat and push / kneeL / B_Activity_5_S4/Folded_seat_shell | S5 destination seat and push / kneeL / B_Activity_5_S4/Folded_seat_shell |
| D04 | destination entry | advance 300 mm; side 550 mm; yaw +30° | Blocked / blocked | Blocked / blocked | S5 destination seat and push / kneeL / B_Activity_5_S4/Folded_seat_shell | S5 destination seat and push / kneeL / B_Activity_5_S4/Folded_seat_shell |
| D05 | destination entry | advance 150 mm; side 700 mm; yaw -30° | Blocked / blocked | Blocked / blocked | S5 destination seat and push / kneeL / B_Activity_5_S4/Folded_seat_shell | S5 destination seat and push / kneeL / B_Activity_5_S4/Folded_seat_shell |
| D06 | destination entry | advance 150 mm; side 700 mm; yaw +30° | Blocked / blocked | Blocked / blocked | S5 destination seat and push / kneeL / B_Activity_5_S4/Folded_seat_shell | S5 destination seat and push / kneeL / B_Activity_5_S4/Folded_seat_shell |
| D07 | destination entry | advance 300 mm; side 700 mm; yaw -30° | Blocked / blocked | Blocked / blocked | S5 destination seat and push / kneeL / B_Activity_5_S4/Folded_seat_shell | S5 destination seat and push / kneeL / B_Activity_5_S4/Folded_seat_shell |
| D08 | destination entry | advance 300 mm; side 700 mm; yaw +30° | Blocked / blocked | Blocked / blocked | S5 destination seat and push / kneeL / B_Activity_5_S4/Folded_seat_shell | S5 destination seat and push / kneeL / B_Activity_5_S4/Folded_seat_shell |
| G01 | left grip | rear corridor 900 mm, plus current chair pull | Blocked / blocked | Blocked / blocked | S5 vacant chair upright approach detour 3 aligned posture / footL / B_Activity_5_S5/Sled_foot | S5 vacant chair upright approach detour 2 aligned posture / torso / /B_Ribbon_3_1080 |
| G02 | left grip | rear corridor 1100 mm, plus current chair pull | Blocked / blocked | Blocked / blocked | S5 vacant chair upright approach detour 1 aligned posture / torso / /Bp_Straight_3_1080 | S5 vacant chair upright approach detour 1 aligned posture / torso / /B_Ribbon_3_1080 |
| G03 | rear-centre grip | rear corridor 900 mm, plus current chair pull | Blocked / blocked | Blocked / blocked | S5 vacant chair release to pad detour 1 aligned posture / pelvis / /Bp_Straight_3_1080 | S5 vacant chair pull/reset / pelvis / /B_Ribbon_3_1080 |
| G04 | rear-centre grip | rear corridor 1100 mm, plus current chair pull | Blocked / blocked | Blocked / blocked | S5 vacant chair upright approach detour 1 aligned posture / torso / /Bp_Straight_3_1080 | S5 vacant chair upright approach detour 1 aligned posture / torso / /B_Ribbon_3_1080 |
| O01 | origin right exit | advance 150 mm; side 550 mm; yaw +0° | Blocked / blocked | Blocked / blocked | S1–S3 origin departure / kneeR / B_Activity_4_S5/Folded_seat_shell | S1–S3 origin departure / kneeR / B_Activity_4_S5/Folded_seat_shell |
| O02 | origin right exit | advance 300 mm; side 550 mm; yaw +0° | Blocked / blocked | Blocked / blocked | S1–S3 origin departure / footR / /B_Activity_4_2 | S1–S3 origin departure / footR / /B_Activity_4_2 |
| O03 | origin right exit | advance 150 mm; side 700 mm; yaw +0° | Blocked / blocked | Blocked / blocked | S1–S3 origin departure / kneeR / B_Activity_4_S5/Folded_seat_shell | S1–S3 origin departure / kneeR / B_Activity_4_S5/Folded_seat_shell |
| O04 | origin right exit | advance 300 mm; side 700 mm; yaw +0° | Blocked / blocked | Blocked / blocked | S1–S3 origin departure / footR / /B_Activity_4_2 | S1–S3 origin departure / footR / /B_Activity_4_2 |
Within each layout, D01–D04 share one first failure and D05–D08 share another. G02/G04 and O02/O04 also share identical first-failure records. O01/O03 hit the same neighbouring chair with slightly different interpolation points before reaching their lateral endpoints. Rear-corridor endpoints at 1.10 m meet a boundary on the first leg. G01/G03 reach different first obstacles or stages in the two layouts: this shows boundary involvement without a complete return or an advantage.
Eight positive replays reproduce the C2 choice 1/9 frame hashes and check counts. An embedded chair connector is blocked and a distant grip exceeds the unchanged 700 mm arm-chain limit. New plan starts match the original rise. Independent checks confirm at most 20 mm pelvis translation and 5° facing change per planned step; the separate 55 mm vertex-displacement check is a discontinuity diagnostic, since rotational vertices travel farther. rigid turns retain the swept arc bound, including the reverse origin connector. The adapter changes route generation only; the collision and floor checks remain unchanged. All frozen geometry inputs remain identical.
127 runtime checks passed. Finite geometric choreography only: not gait, comfort, human success rates or a global accessibility claim. No furniture or native Rhino geometry changed. The uncalibrated D1 loop and blue D2 geometry remain; D2 flow has not been recomputed.
C2 / 30 OCT 2026 / COMPUTATIONAL FOLLOW-UP
We completed 96 attempts: the original 24 declared strategy combinations × B′72/B72 × basic/target-occupied conditions. Each condition gives 2/24 complete returns. The passing pair is the same directional pattern at two offsets, not two independent route families.
C2 / 96 scripted attempts: both passing choices use the same directions: leave A to the left, enter B from the right and approach B's backrest from the right. The tested lateral offsets are 550 and 700 mm. These are finite strategy counts, not human success rates.
The buffer is a horizontal square offset around the mover against surrounding fixed obstacles and stationary occupants only. Body-to-A/B-chair, moving-chair and floor checks remain nominal, with no collision exemptions. The accepted C1 choice passes 50 mm and first fails at the tested 75 mm level, at the starting right foot / T4 table base, in all four conditions. This is not a whole-cycle minimum clearance.
Minimum plan separation from the accepted swept mover envelope to the boundary: 279 mm (B′72) / 220 mm (B72). The two boundary shapes give the same tested pass/fail pattern; this does not establish a performance advantage.
Origin exit side, destination entry side, lateral offset (550/700 mm) and standing grip position (left/right side or rear centre) were varied exactly as declared for C1. All grip routines still use the same right-hand geometric chain; a left-hand grip was not tested. Furniture, body dimensions, 300 mm chair pull and the pad route were held. The occupied condition adds five stationary seated bodies, not moving people.
Choice 1 retains C1's 836 states. Choice 9 uses 878 states. Both restore the body and both chairs. A failure stops that attempt at the first collision; downstream stages in that attempt were not evaluated. A blocked scripted transition is not proof that a person or another route cannot pass.
4/24 — Approach B: left knee / B chair shell; 2/24 — Enter B: left knee / B chair shell; 12/24 — Departure A: right knee / adjacent T4-S5 chair shell; 4/24 — Approach B: left foot / B sled rail. These same first-failure categories occur in all four conditions.
L/R are relative to the seat's facing direction. E = basic condition; O = five additional target occupants. IDs here are 1–24; computation indices are 0–23. Counts do not estimate a probability.
| ID | A exit / B entry | Offset mm | Grip position | B′ E | B′ O | B E | B O | First result |
|---|---|---|---|---|---|---|---|---|
| 1 | L / R | 550 | R side | Clear | Clear | Clear | Clear | Complete return |
| 2 | L / R | 550 | L side | Blocked | Blocked | Blocked | Blocked | Approach B: left knee / B chair shell |
| 3 | L / L | 550 | R side | Blocked | Blocked | Blocked | Blocked | Enter B: left knee / B chair shell |
| 4 | L / L | 550 | L side | Blocked | Blocked | Blocked | Blocked | Approach B: left knee / B chair shell |
| 5 | R / R | 550 | R side | Blocked | Blocked | Blocked | Blocked | Departure A: right knee / adjacent T4-S5 chair shell |
| 6 | R / R | 550 | L side | Blocked | Blocked | Blocked | Blocked | Departure A: right knee / adjacent T4-S5 chair shell |
| 7 | R / L | 550 | R side | Blocked | Blocked | Blocked | Blocked | Departure A: right knee / adjacent T4-S5 chair shell |
| 8 | R / L | 550 | L side | Blocked | Blocked | Blocked | Blocked | Departure A: right knee / adjacent T4-S5 chair shell |
| 9 | L / R | 700 | R side | Clear | Clear | Clear | Clear | Complete return |
| 10 | L / R | 700 | L side | Blocked | Blocked | Blocked | Blocked | Approach B: left knee / B chair shell |
| 11 | L / L | 700 | R side | Blocked | Blocked | Blocked | Blocked | Enter B: left knee / B chair shell |
| 12 | L / L | 700 | L side | Blocked | Blocked | Blocked | Blocked | Approach B: left knee / B chair shell |
| 13 | R / R | 700 | R side | Blocked | Blocked | Blocked | Blocked | Departure A: right knee / adjacent T4-S5 chair shell |
| 14 | R / R | 700 | L side | Blocked | Blocked | Blocked | Blocked | Departure A: right knee / adjacent T4-S5 chair shell |
| 15 | R / L | 700 | R side | Blocked | Blocked | Blocked | Blocked | Departure A: right knee / adjacent T4-S5 chair shell |
| 16 | R / L | 700 | L side | Blocked | Blocked | Blocked | Blocked | Departure A: right knee / adjacent T4-S5 chair shell |
| 17 | L / R | 550 | Rear centre | Blocked | Blocked | Blocked | Blocked | Approach B: left foot / B sled rail |
| 18 | L / L | 550 | Rear centre | Blocked | Blocked | Blocked | Blocked | Approach B: left foot / B sled rail |
| 19 | R / R | 550 | Rear centre | Blocked | Blocked | Blocked | Blocked | Departure A: right knee / adjacent T4-S5 chair shell |
| 20 | R / L | 550 | Rear centre | Blocked | Blocked | Blocked | Blocked | Departure A: right knee / adjacent T4-S5 chair shell |
| 21 | L / R | 700 | Rear centre | Blocked | Blocked | Blocked | Blocked | Approach B: left foot / B sled rail |
| 22 | L / L | 700 | Rear centre | Blocked | Blocked | Blocked | Blocked | Approach B: left foot / B sled rail |
| 23 | R / R | 700 | Rear centre | Blocked | Blocked | Blocked | Blocked | Departure A: right knee / adjacent T4-S5 chair shell |
| 24 | R / L | 700 | Rear centre | Blocked | Blocked | Blocked | Blocked | Departure A: right knee / adjacent T4-S5 chair shell |
Choice 1 only. Tested offsets: 0, 5, 10, 20, 30, 50 and 75 mm; each ladder stops at its first failure. Planned 100 mm was not run after the 75 mm failure. A separate 300 mm negative control also fails. The first failed level is not an exact gap or a Euclidean upper bound, and the ladder has no uniform 5 mm resolution.
Only mover-versus-external-scene swept hulls receive the XY square offset, after the original turn-arc bound. All nominal collision checks remain, including against both operated chairs. No seated-body, hand or forearm contact exemptions were added. This is a scoped sensitivity diagnostic, not an enlarged human percentile or a global clear-space certificate.
Distances are between XY projections of swept convex envelopes and the union of actual boundary-triangle projections. They ignore height separation and are conservative envelope projections, not measured physical contact distances. The two variants are calculated independently. This gap metric covers the 12 named straight/ribbon boundary-panel mesh components in each model; separately named supports or fittings are not included in the gap metric. All objects in the external scene still participate in nominal collision checks.
| Projection checked | B′72 | B72 |
|---|---|---|
| Swept mover envelope | 279.4 mm | 219.8 mm |
| Operated chairs, including rest states | 468.4 mm | 424.5 mm |
| Three stationary origin peers | 890.4 mm | 888.8 mm |
| Five stationary target occupants | 907.8 mm | 897.9 mm |
The minimum mover projection gap occurs during the chair-reset reach turn, at the left elbow. This tested cycle remains separated from either boundary; no conclusion about conversation, participation or scent experience follows.
All four nominal replays reproduce C1's 836 saved states and 17,170 checks. Occupied replay stages match the earlier occupied result. Controls detect an embedded table-centre box and an embedded active-chair backrest box; an analytic 10 mm gap passes 0/5/10 mm offsets and fails 20 mm. Baseline input hashes remain unchanged.
Finite geometric choreography, not gait, comfort, balance, force or global accessibility. The D1 animation is still an uncalibrated reference field; D2 flow was not recomputed. No furniture or Rhino geometry change and no human test occurred. Native Rhino originals remain private.
CURRENT / C1 CLOSE CYCLE + F1b GEOMETRY + S2 BLACK FIGURES
Retained original C1/F1b choreographies: the frame counts, saved poses and local margin tests below precede V5. Current shorter full traces are reported at the top of this page.
NEW / C1 CLOSE CONTACT CYCLE + FULL-SCALE MOCKUP KIT
Activity 4 / S6 → Activity 5 / S4 → original seat
Both B′72 and B72 complete the full round trip using the retained F1b furniture layout. No further furniture moves were needed.
| C1 check | B′72 | B72 |
|---|---|---|
| Full cycle / body and chairs restored | 836 states / pass | 836 states / pass |
| Swept body-part and chair checks | 17,170 | 17,170 |
| Five other destination seats occupied | Pass | Pass |
| Further furniture moves / total seats | 0 / 72 seats | 0 / 72 seats |
The seat centres are 1.405 m apart. The previously reported 0.221 m measures only the route between release pads; it excludes chair handling, rising, entry, sitting and return. The complete cycle uses the same 20-part collision body. A positive minimum clearance for the whole cycle has not been established.












This is a nearby move intended to retain contact. Static sightline checks retain reciprocal views to 3 of 3 peers in the basic condition and 2 of 3 with additional occlusion; they do not demonstrate continued conversation. Maximum stationary AUC ratios are 0.9616 / 0.9618 for B′ / B. This is distinct from the lower-exposure candidate below. The earlier 100 mm local clearance result does not apply to this route.
Set out two tables, twelve chairs and one boundary segment within a 5.2 × 3.4 m working area. Furniture coordinates are identical in both alternatives. The datum, orthogonality checks, chair feet, 300 mm pull positions and boundary coordinates match the drawings and Rhino. In the declared digital cycle, chair A stays pulled out by 300 mm until the final return. For physical observations, use the dedicated C1 field protocol and record the actual pull distance without forcing it.
Print at 100% actual size and measure the calibration line. The A3 drawings and A0 template have different scales. Observation fields remain blank. Use the record to observe the round trip, contact, twisting and assistance without adding scent.
In the private authoring model, PEOPLE_C1_PRESENTATION_NOT_PHYSICAL contains the saved black-figure poses and Illustration layers. Collision_reference holds the separate tested body. Physical chairs remain at rest in Rhino; consult the matching page image for pulled-chair states. C1_SETTING_OUT contains installation outlines and datum axes in world coordinates. The new C1_Close_Cycle_Parallel view accompanies all 17 retained views.
These checks cover declared geometric translations and rotations, not gait, joint limits, balance, force or comfort. The earlier S2 exposure-case figure layers are preserved separately; do not enable them together with C1. Neither positive clearance throughout the cycle nor the same result for other body sizes is guaranteed.
C1 field kit and test protocol →
The tight 75° entry has been replaced. Move Activity 6 and its six chairs 650 mm west, and Activity 5 and its six chairs 100 mm west—in both layouts. After the 300 mm chair pull, the conservative horizontal gap to the end glazing is 974 mm. The local standing passage clears an additional 100 mm XY buffer with no added body twist.
The end-table group moves 650 mm west and the neighbouring group 100 mm west, identically in B′ and B. Seat count, furniture dimensions and angles are retained. All previously available 600 mm release pads and chair-pull conditions remain. The earlier 10 mm / 75° entry is superseded.
| At the destination | Previous E1b | Current F1b / B′ and B |
|---|---|---|
| Furniture adjustment | None | Activity 6:650mm west / Activity 5:100mm west |
| Pulled-chair / glazing X-gap | 324mm | 974mm |
| Additional entry body yaw | Up to75° | 0° |
| Local standing XY buffer | 10mm | 100mm / swept replay at5mm intervals |
| Seats / blue D2 ducts | 72 / D2 | 72 / same D2 geometry |

The retained lower-exposure move is B_Activity_2_S4 → B_Activity_6_S3. Each layout completes 3,455 recorded frames and 69,550 swept-part checks with the enlarged 20-part body envelope. Both chairs and every body vertex return to their initial state. The same body/chair trajectory is used in B′ and B. An additional run with all five other destination chairs occupied also completes; this is not a simultaneous crowd test.











The 100mm buffer applies only to the local standing bypass, not the entire route, hand contact or seated contact. The complete cycle is checked using the nominal enlarged body envelope. Gait, joint limits, balance, force, comfort and other body sizes still need human validation. Illustrative figures — not anthropometric. Clearance still comes from the unchanged F1b collision bodies. These twelve saved scenes were checked for mesh intersections with the furniture and barriers; this is not a new continuous-motion check. The standing passage views and the original-seat views use two declared orthographic cameras, matched between B′ and B.
The dashed comparison distinguishes the illustrative figure from the retained 20-part collision body. The F1b route, seats, chair pulls and results are unchanged. Both representations are stored on separate Rhino layers.
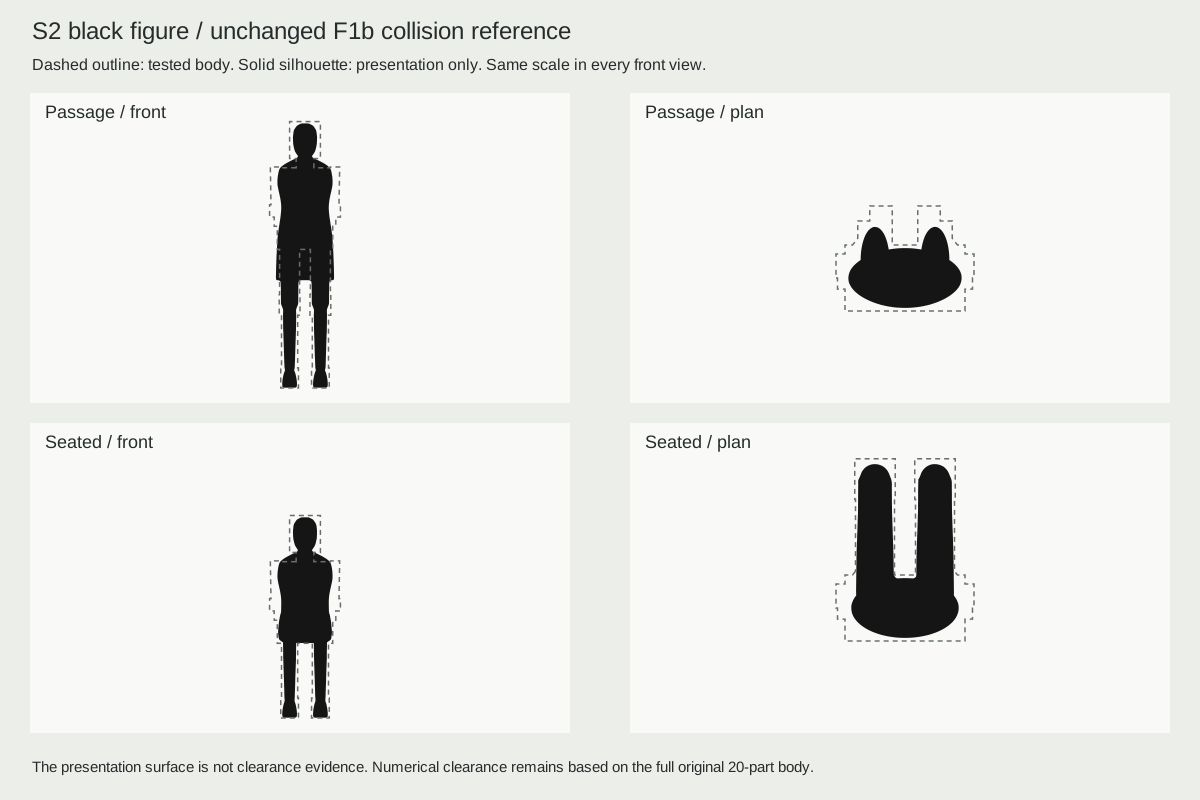
All72 seats were rechecked for chair release and600/900mm circulation, three eye heights, shared-task sightlines and stationary exposure sampling. The transport model does not resolve furniture as flow obstacles; its saved field is retained and moved seats are sampled again. The ranked lower-exposure seat remains the same, with maximum destination/origin AUC ratios of 0.6304 /0.6308 for B′/B. Neither reaches the illustrative0.5 reference.
The combined starting-group count remains15 in each layout. At the wider900mm disc, three previously available release pads are lost (Activity4_S6, Activity5_S4 and Activity5_S6), while two others are gained:50 →49 seats with pads. This local improvement is therefore not an across-the-layout accessibility improvement. The separately reranked visual-contact candidate becomes B_Activity_4_S6 → B_Activity_5_S4; that candidate now completes the C1 full stateful cycle described above. The previous fixed contact examples were rerun and still complete. Earlier candidate diagrams and stationary tables below are retained as dated baseline evidence, not current F1b results.
The bounded end-table search tested350,450,550 and650mm west translations, against a declared900mm gap target and100mm buffered straight standing bypass.650mm was the first tested translation to meet those criteria. It initially blocked an adjacent release pad; moving Activity5 and its chairs100mm west restores it. An early in-process pad comparison reused stale layout data; those rejected rows are explicitly invalidated in the audit and replaced with fresh-input runs. No global optimum or universal comfort claim is made.
All72 physical chairs remain. Native Rhino copies preserve every other geometry object, the blue duct system and all15 named views. The new PEOPLE_S2_PRESENTATION_NOT_PHYSICAL root contains six hidden pose groups. Each has Illustration and a separate hidden Collision_reference containing the unchanged F1b body. The private authoring file stores each pose separately. Physical chairs remain at rest in the native model; at pulled-chair phases consult the matching page image for the complete chair state. The prior clothed F1b presentation meshes are replaced only in these new copies; earlier studies remain archived. All 15 earlier named views are retained, with S2_Passage_Parallel and S2_Original_Parallel added. The cutaway omits front facade fins/glass and roofs; upper beams and objects beyond 4.2 m of each view centre are omitted identically in B′ and B.
Earlier E1b wireframe / supersededCURRENT B′/B IMAGES / F1b FURNITURE + UNCHANGED BLUE D2 DUCTS
D2 / BLUE SERVICES AS ARCHITECTURE
The cobalt colour stays. The supply system now uses flat-oval sections, a 650 mm centreline bend at the air-handling unit, three lower branches aligned with the bays, and dark-blue joint collars. The hierarchy follows the retained nominal flow areas: 775 × 350 mm main, 504 × 250 mm bay, 289 × 180 mm branch.
The Centre Pompidou’s blue air-service code informs the colour choice, not a copied building geometry.
HAS-Vent Colorduct II and its flat-oval product guide support the use of a painted, visibly jointed oval system. This model is a custom design study, not a manufacturer-certified selection.
Three roof/ceiling penetration interfaces remain in each option. Sleeves/openings, hollow junction fabrication, secondary service/support coordination, pressure loss, acoustics and outlet performance still need detailing. Equal section area and unchanged outlets do not establish equal real performance.
The 18 supply terminal meshes and centres, source, extract and specified flow are retained. The live loop above remains the reference D1 calculation and geometry. These D2 renders and Rhino copies do not claim that the new duct system has been flow-validated.
D2 MODEL / MATCHED ARCHITECTURAL VIEWS
D2 architectural views use the established black studio model language. Cobalt supply, dark blue general extract and red LEV make the service systems legible. All three alternatives use the same camera, lighting, exposure, crop and material rules.
Different rooms offer different modelled exposure conditions. Moving between rooms uses the front entries and vestibules; continued contact is unverified.
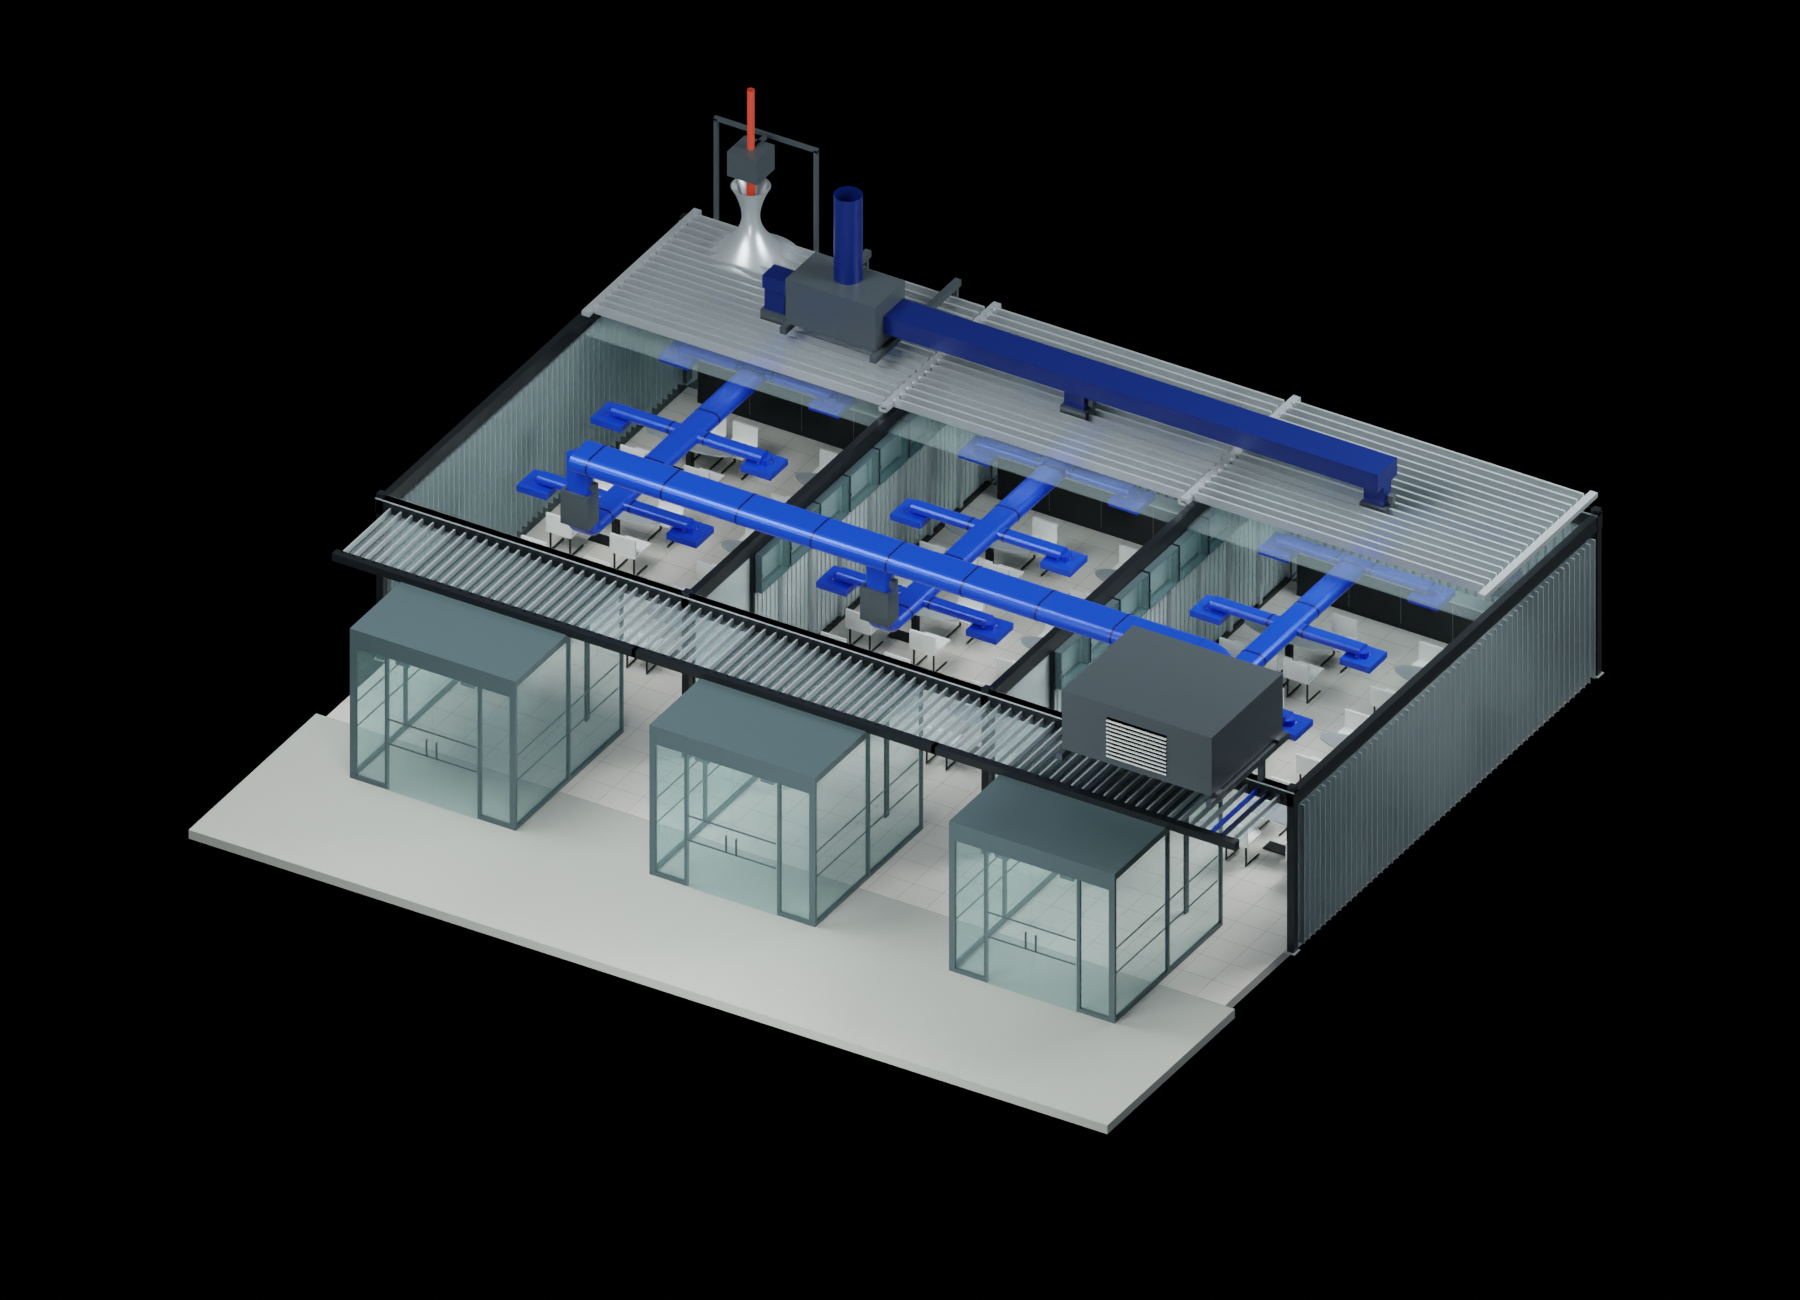
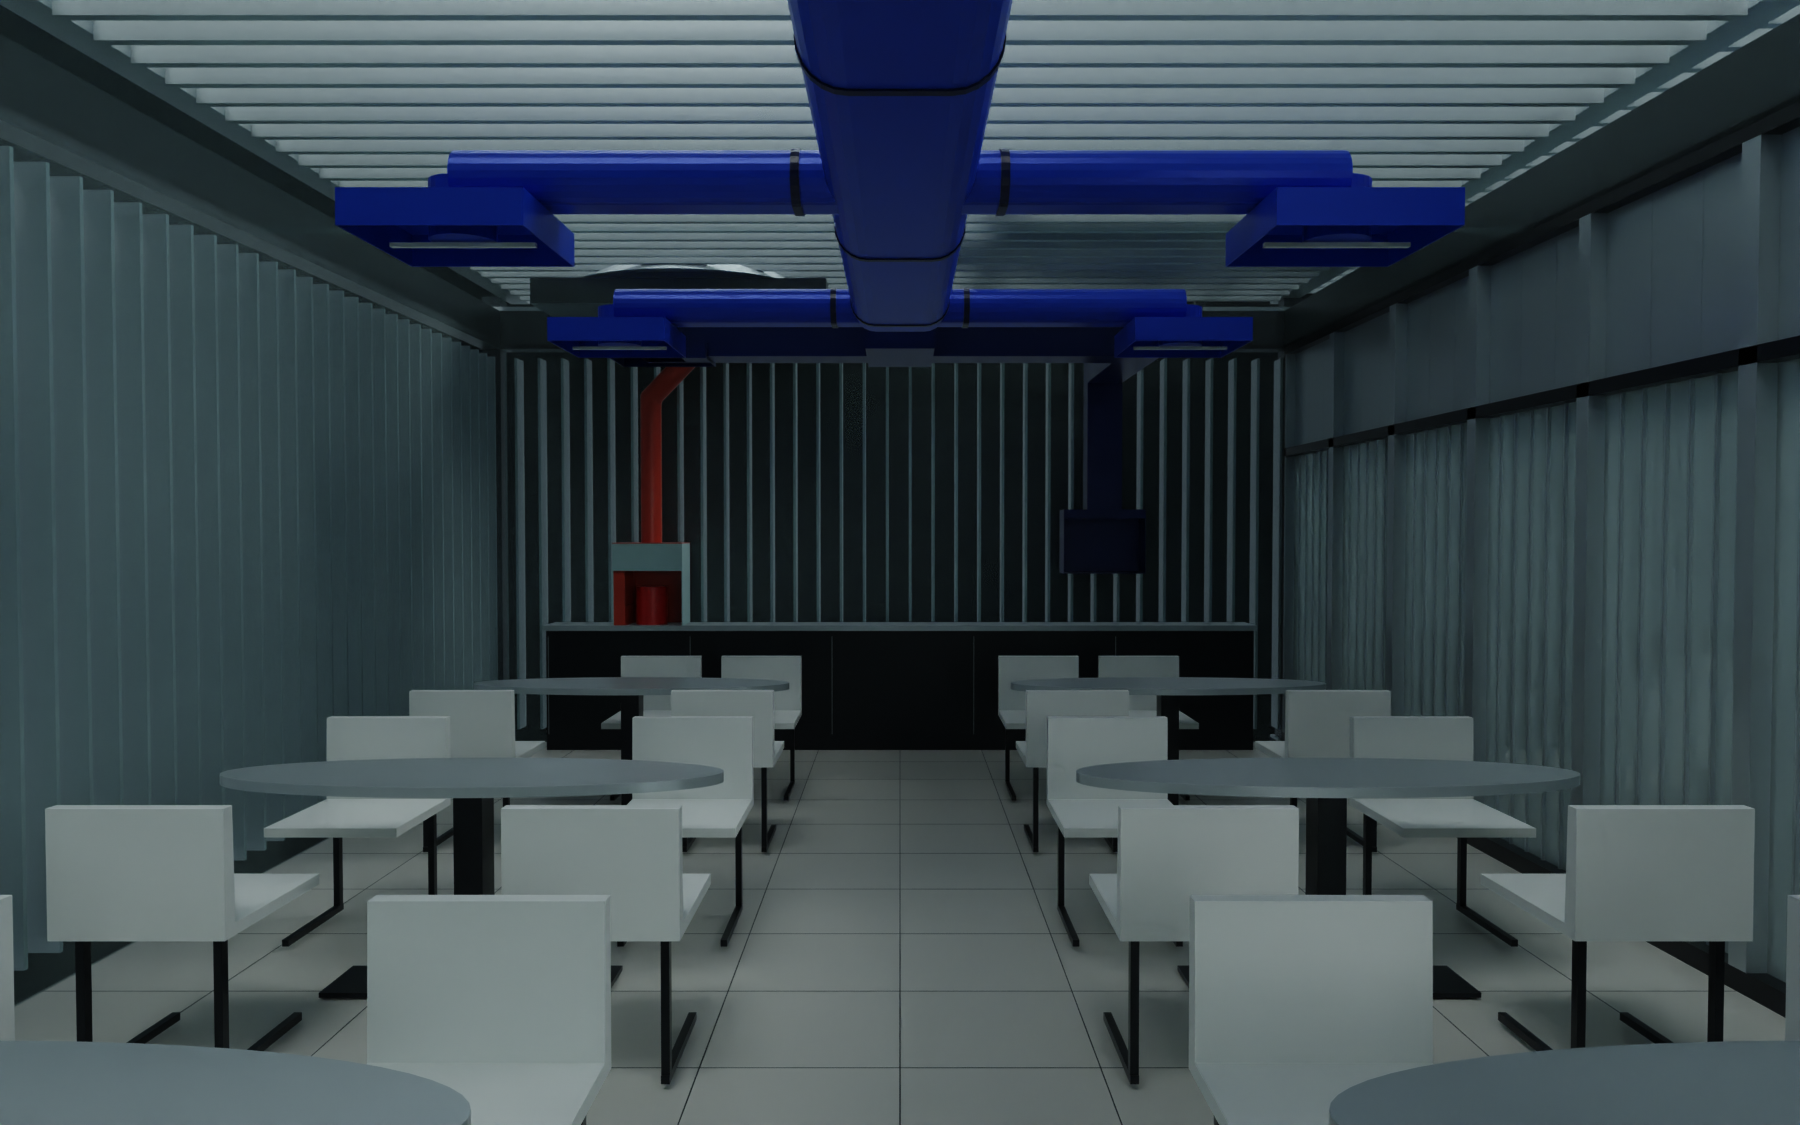
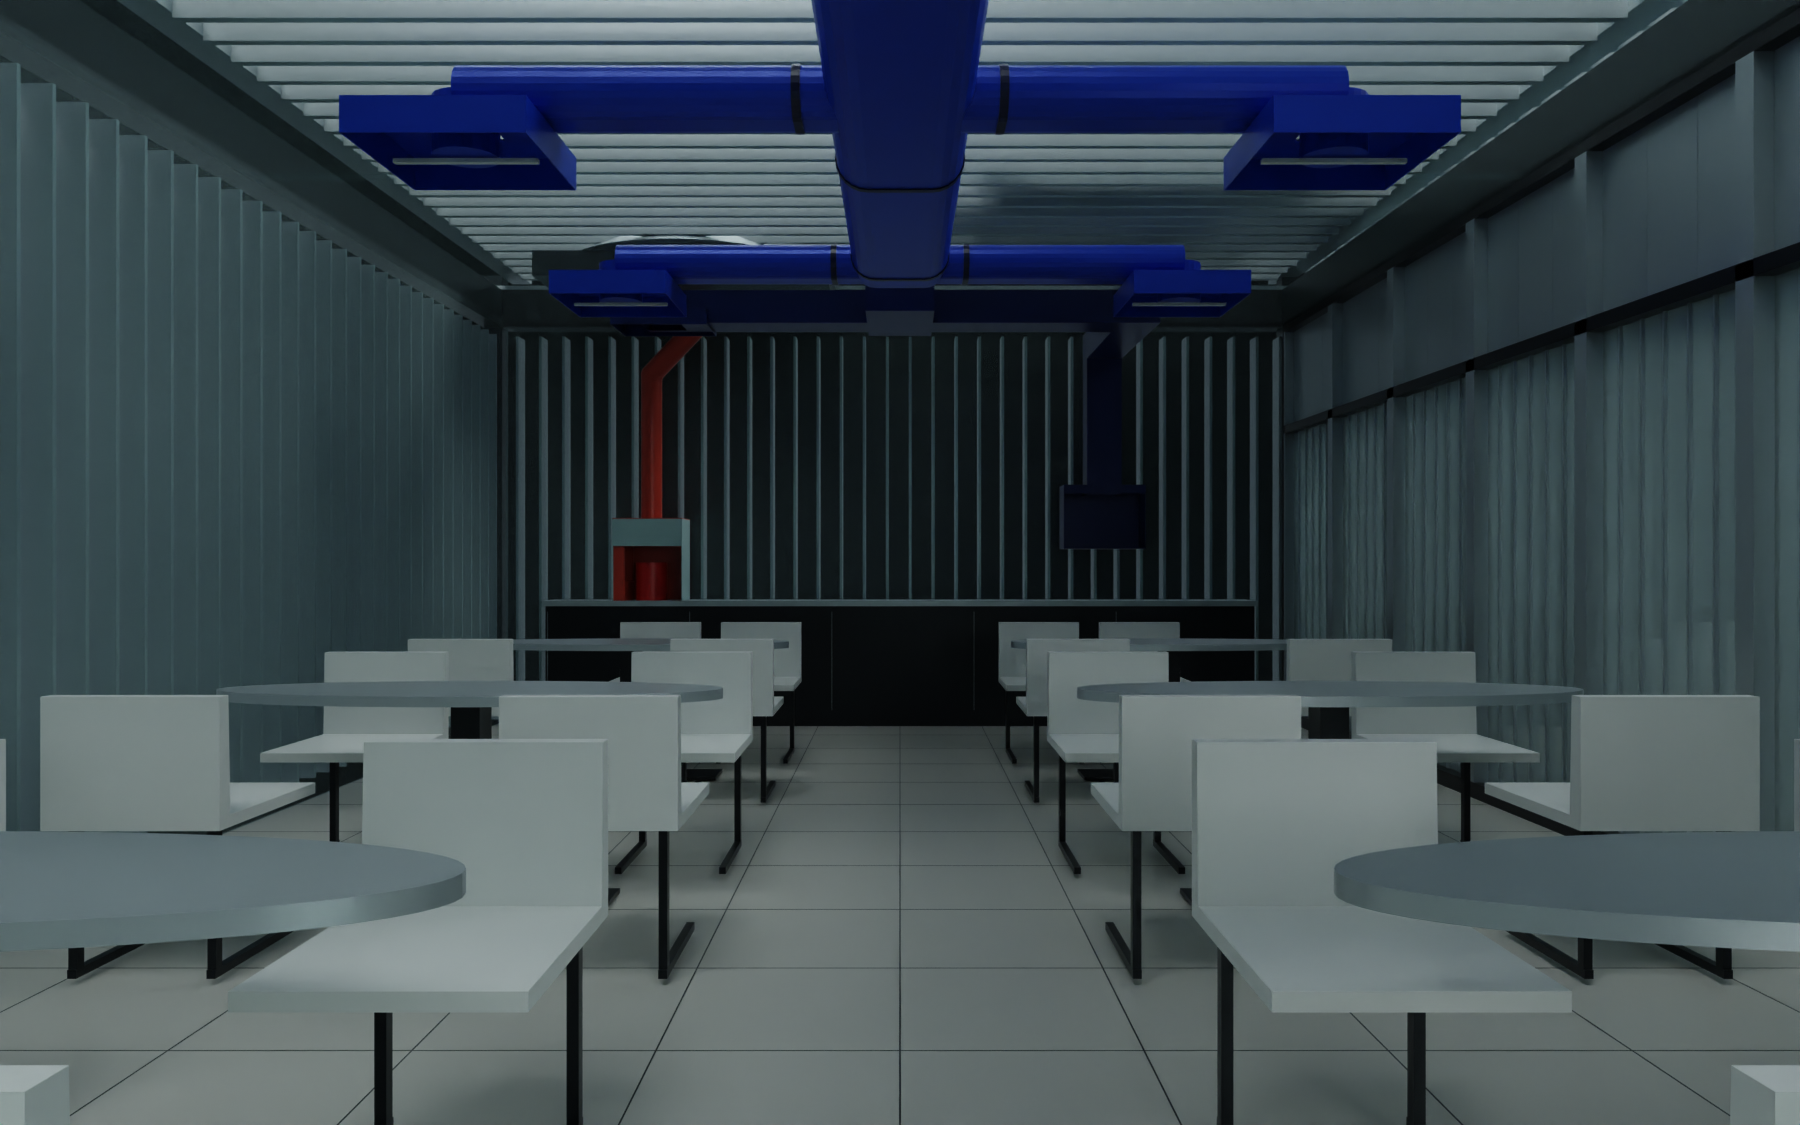
Low boundaries organise places around a common activity row. Continuity is a spatial intention; participation and scent avoidance are not yet demonstrated.
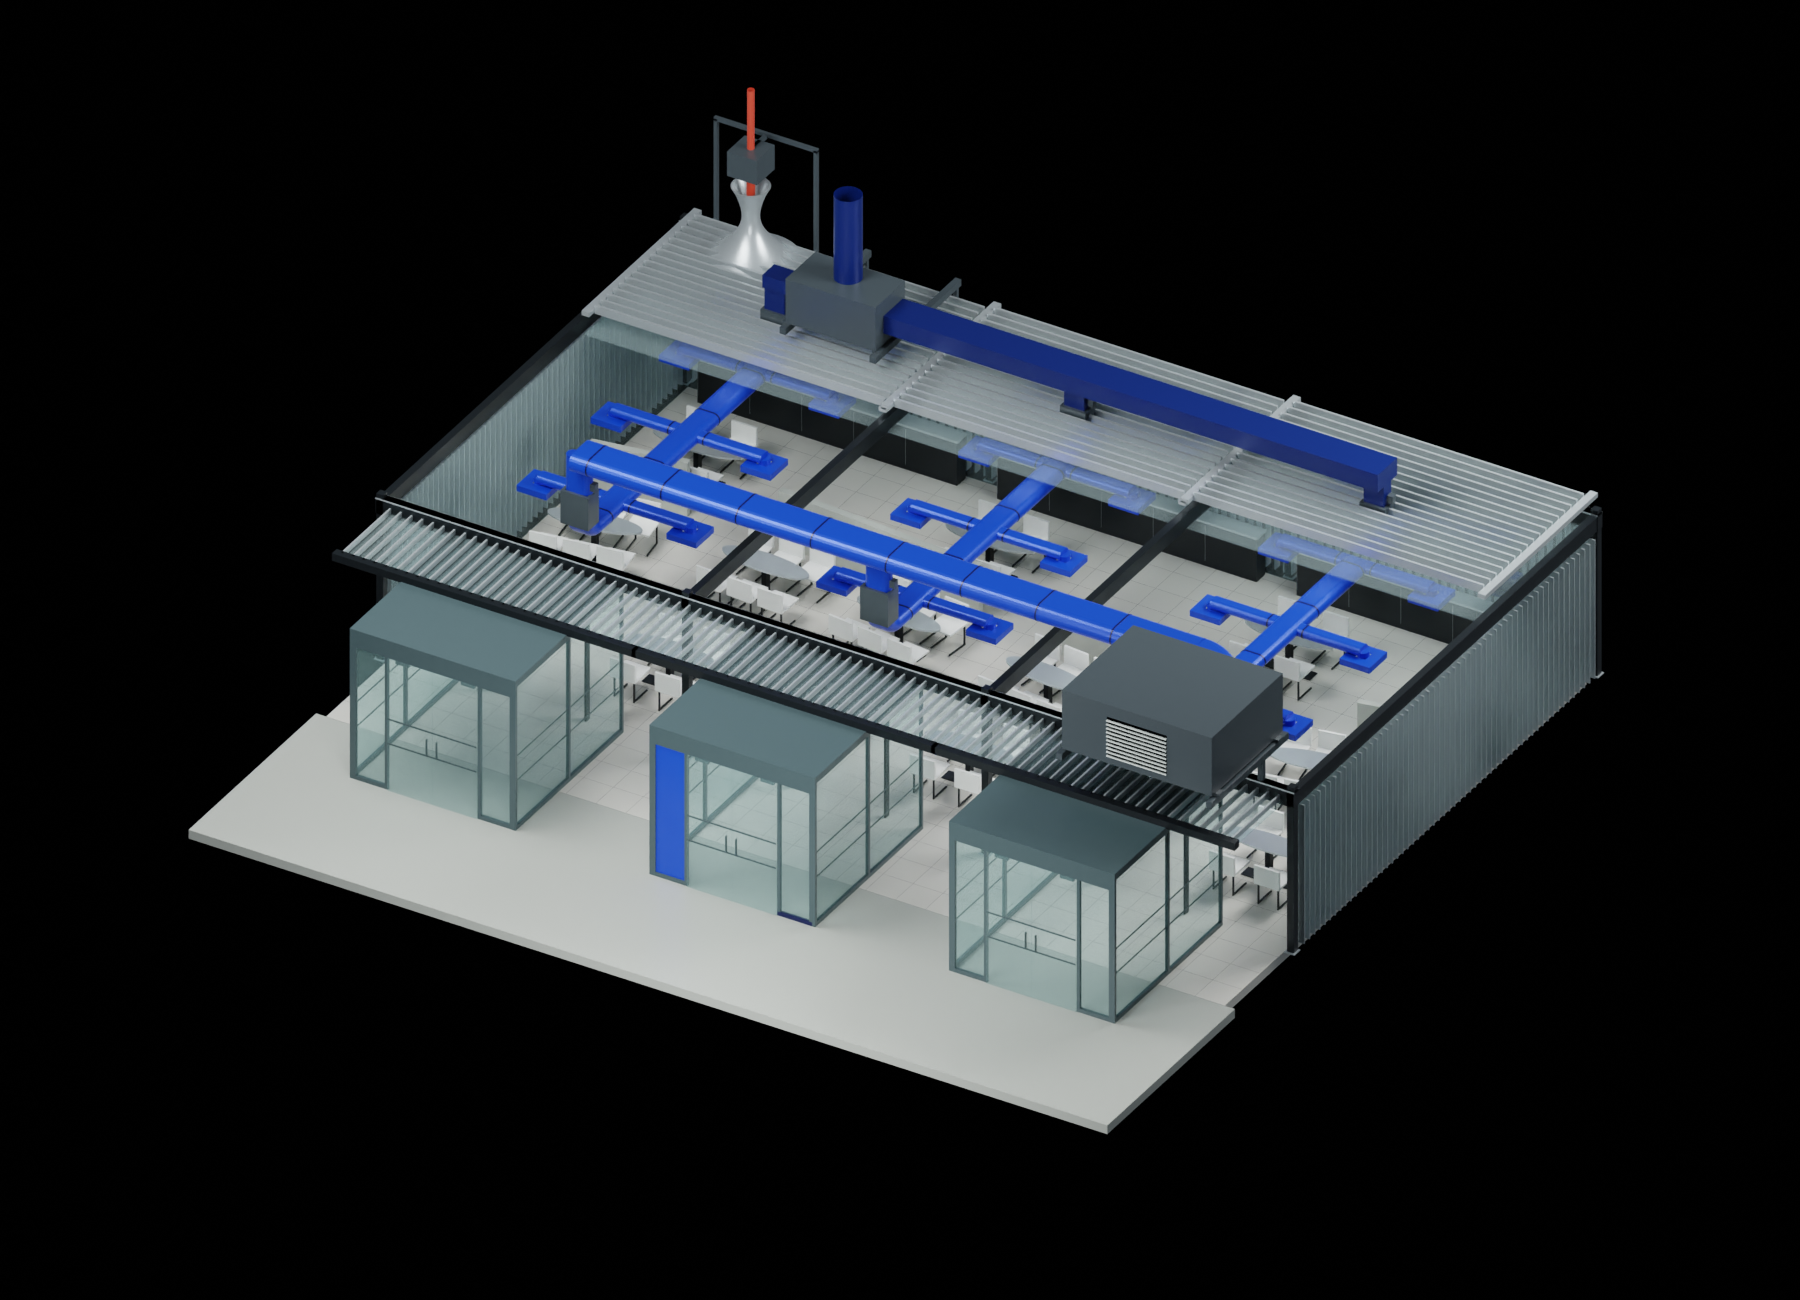
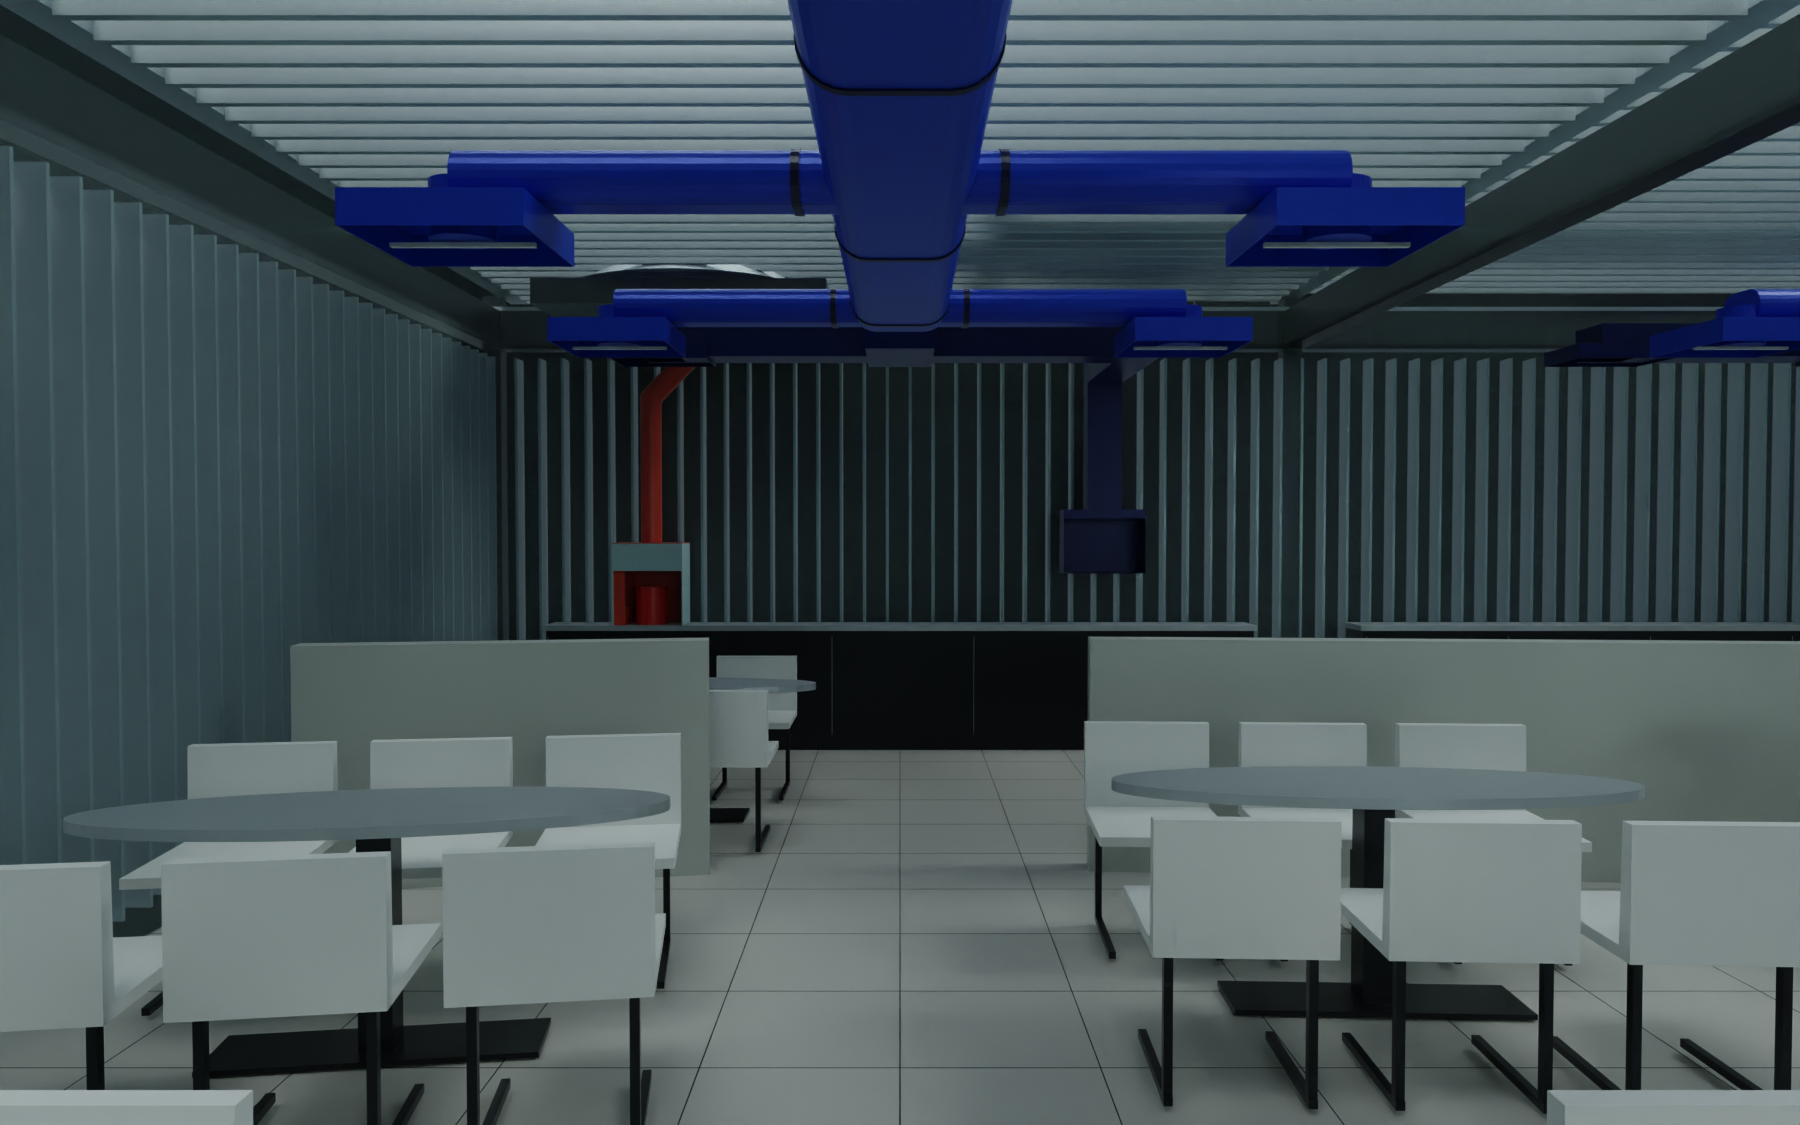
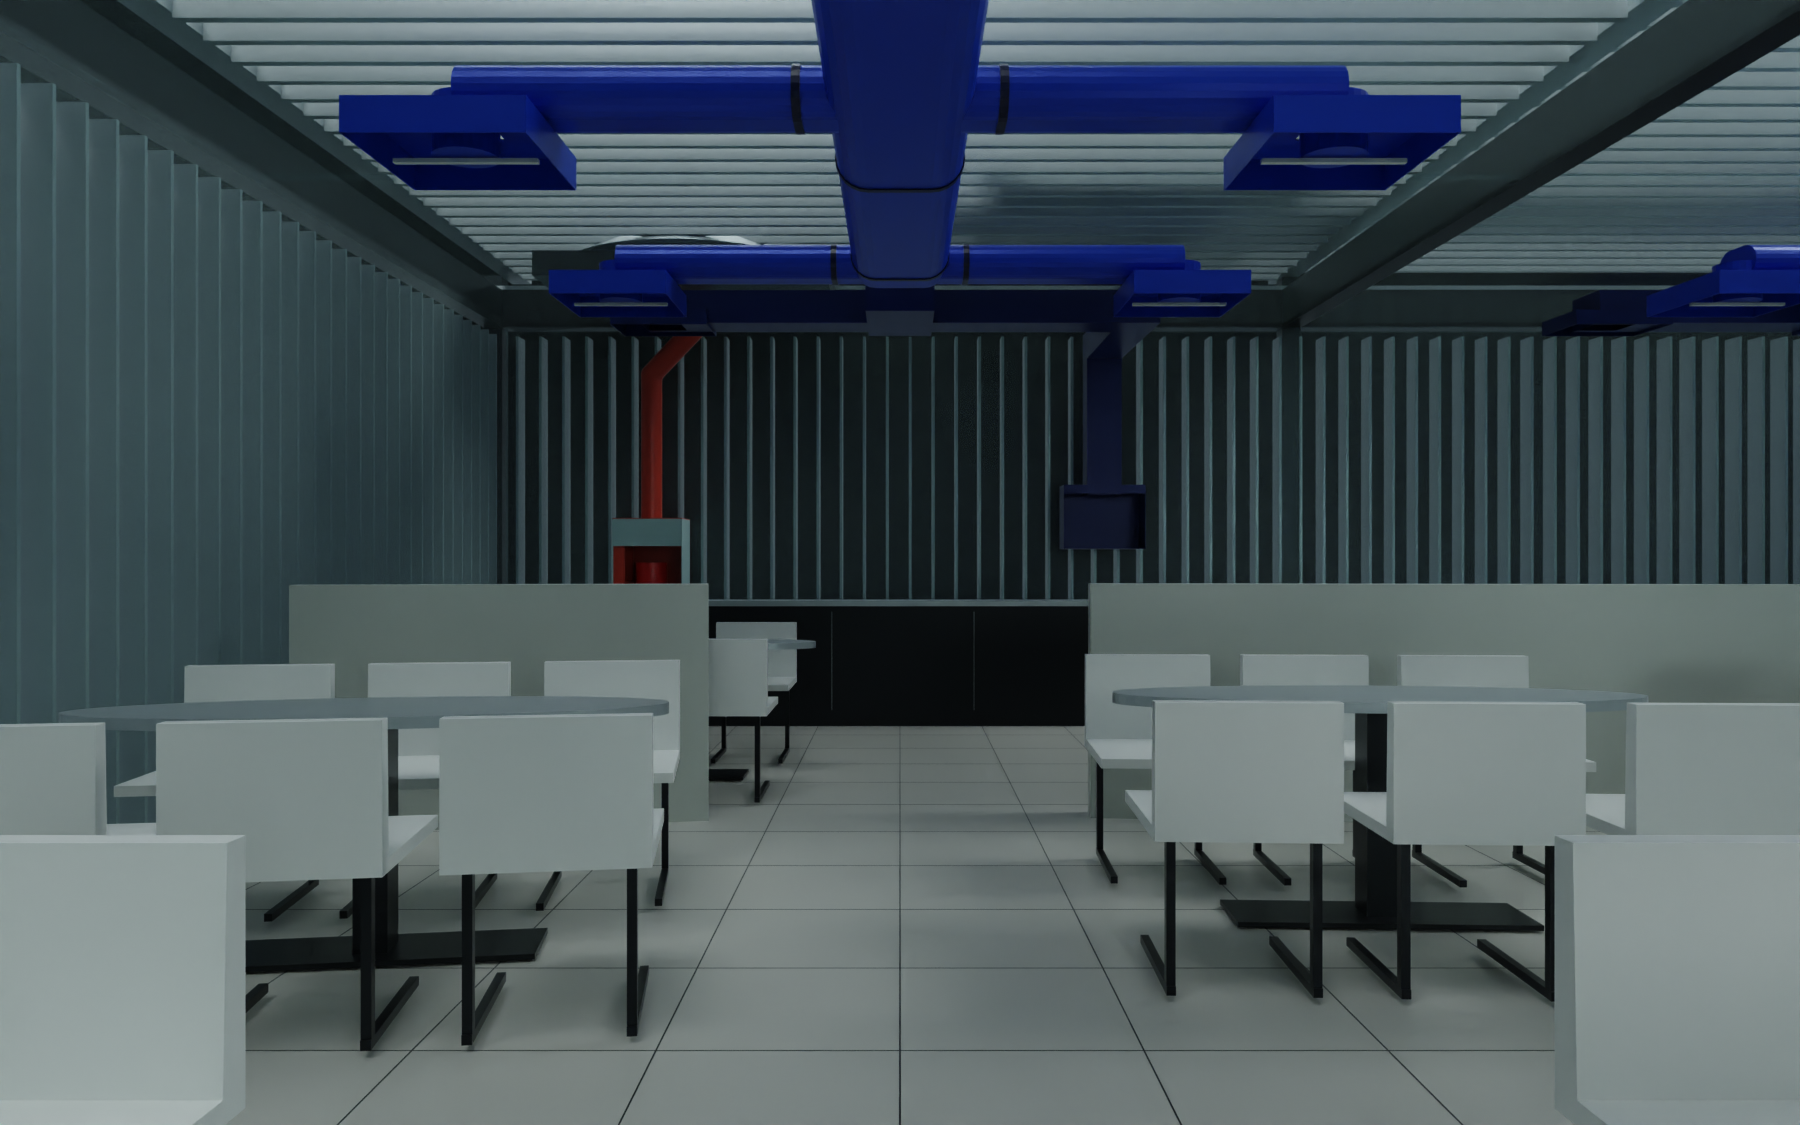
The same furniture and openings as B′, with a curved boundary. Current evidence does not resolve an advantage from that curvature.
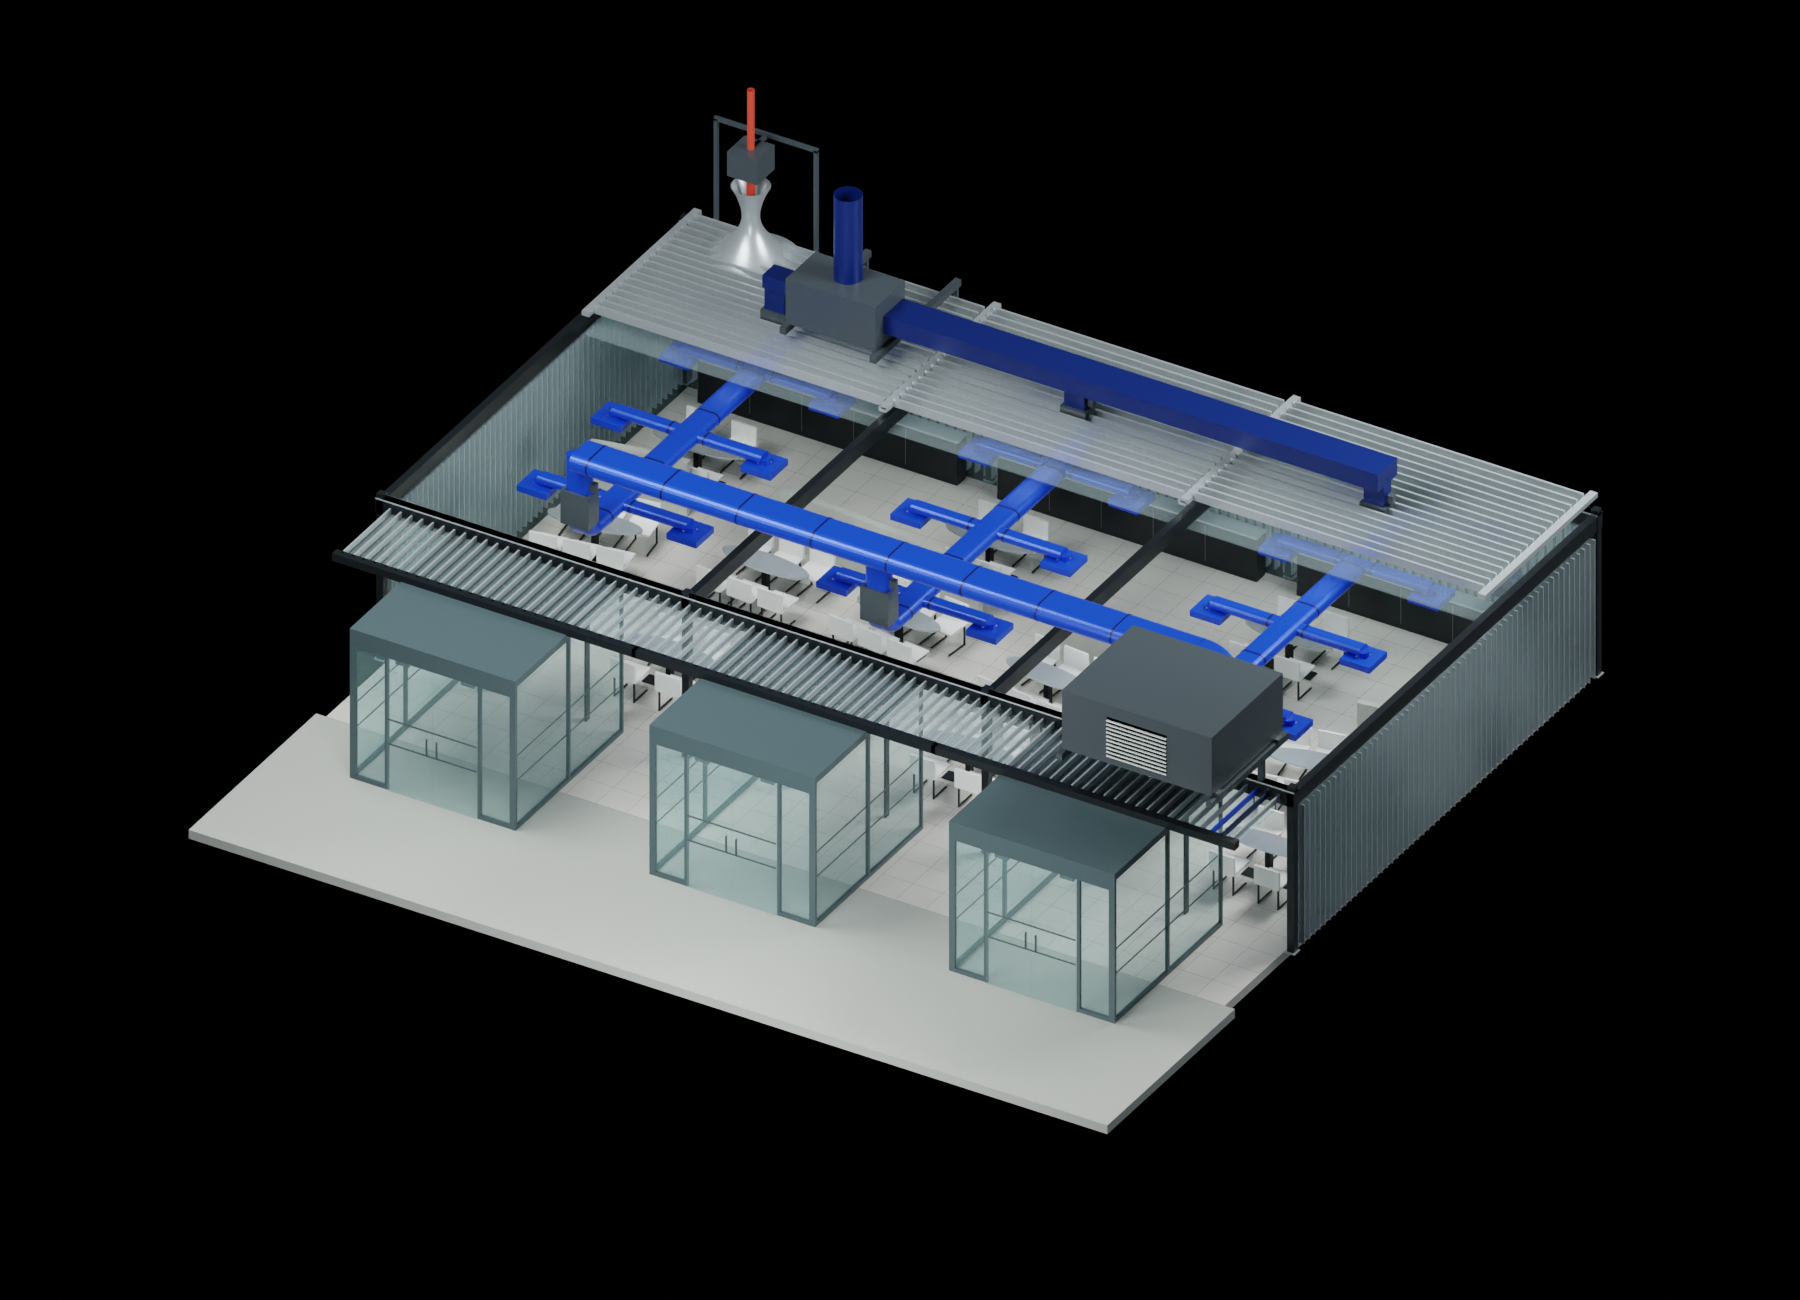
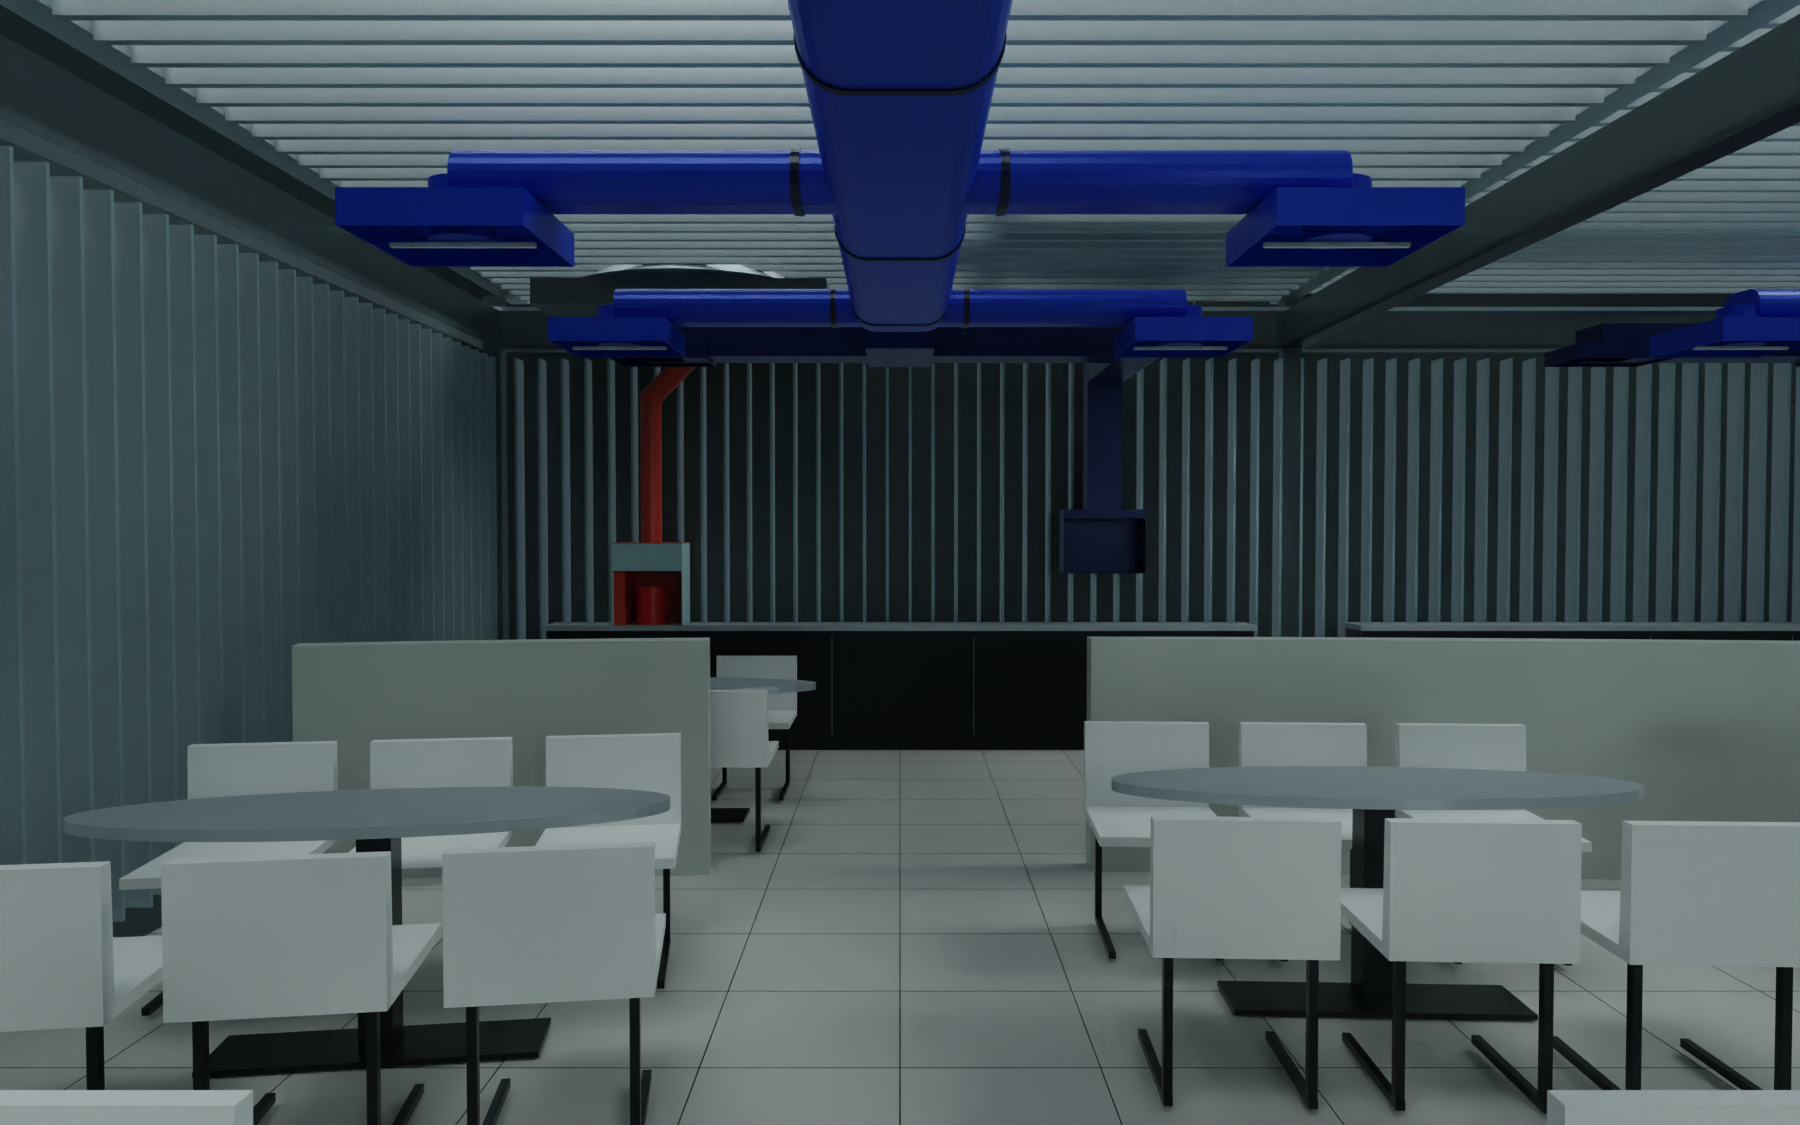
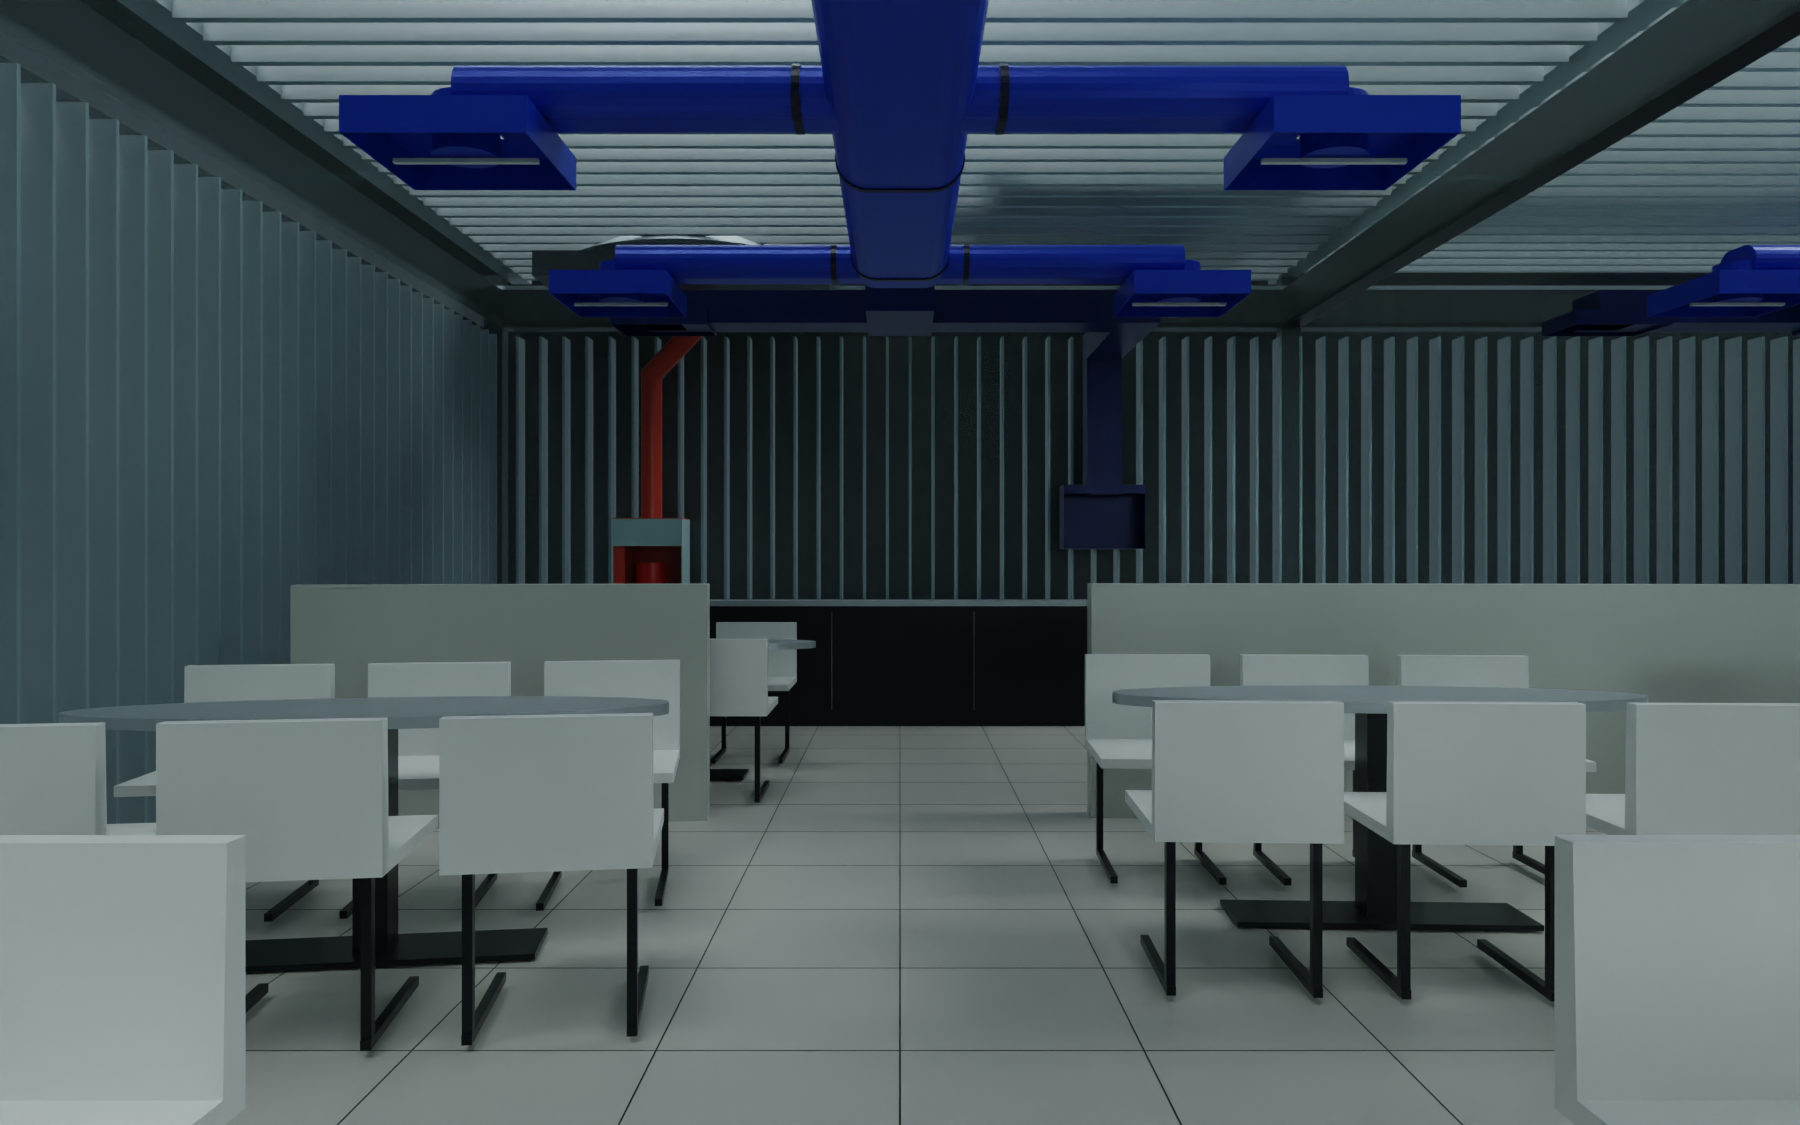
These are architectural renders of the D2 outer-envelope design on retained Rhino architecture, not photographs. Glass transparency is illustrative and cannot establish contact through a cassette. The same room-axis cameras and all 15 prior named views remain in the new Rhino copies. The live simulation above remains a separate, continuous wireframe loop.
CONNECTED TRANSPORT / A72 · B′72 · B72
A now participates in the calculation. The original closed louvre blades, backing glass and gaskets remain in the model. Sixteen effective joint interfaces connect its three rooms at the cassette locations. Each whole partition uses an assumed 0.003 m² leakage area, tested at 0.0003 and 0.03 m². This is joint leakage, not a claim that the full louvre face is open. The unsupported lower 30 m³/h bypass is removed.
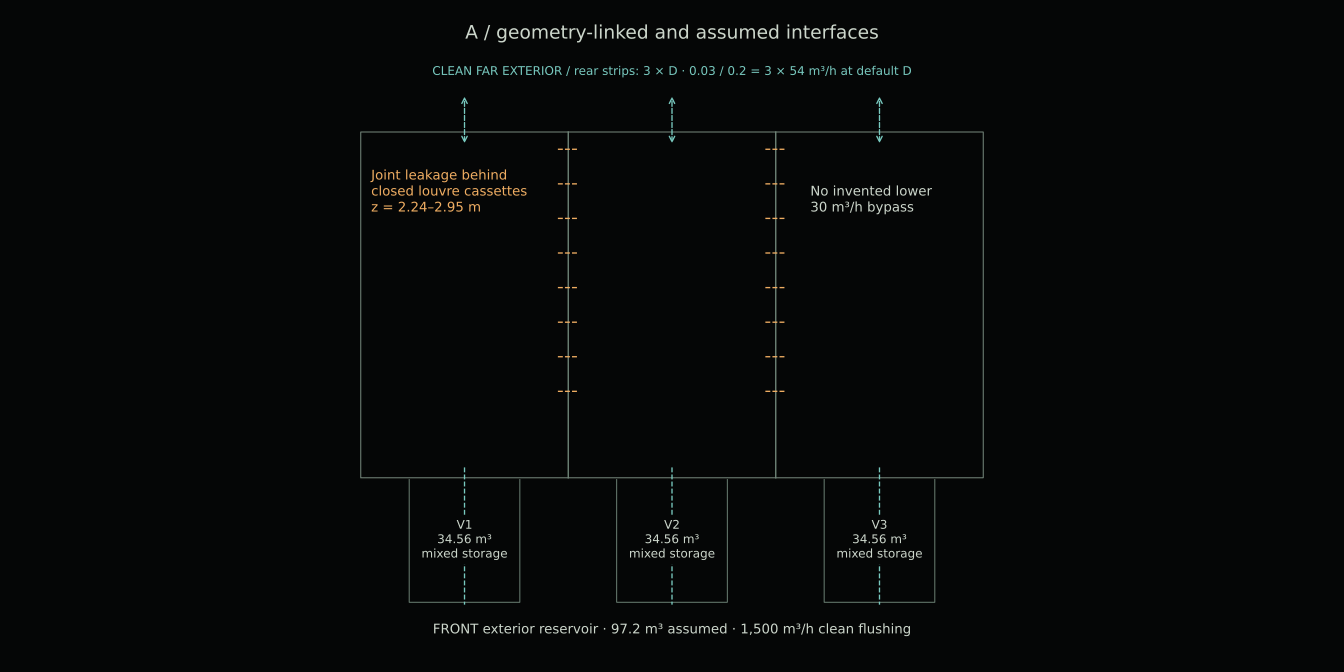
Each interior door connects to its own 34.56 m³ vestibule; each outer door connects that vestibule to the same finite exterior reservoir. The three vestibules are well-mixed storage volumes. The front exterior is an assumed 97.2 m³ mixing reservoir with 1,500 m³/h clean flushing, allowing tracer to leave and return. Neither is a resolved airflow field. Rear envelope strips, general extract and LEV discharge to a separate clean far exterior. Rear strips have no tracer-return connection to the front reservoir. The catalogue and diagram include both exterior destinations.
The same event repeats every 20 model minutes: a 600-second unit release followed by 600 seconds of clearing. During release, all three entries use the same minute schedule: outer door open 0–12 s, both closed 12–16 s, inner door open 16–28 s, both closed 28–60 s. All doors remain closed during clearing. This is an assumed operating schedule, not a count of arrivals or occupants. The wireframe shows nominal door-leaf positions; it does not animate their swing.
All three alternatives retain supply 4,680, general extract 4,320 and LEV 360 m³/h. They share the source, distinct 0.22 m source/LEV sampling radii, mixing coefficient, door schedule and outside conditions. The source is the declared 0.5 m hood-offset scenario. Its position and emission are not measured. The smaller, non-overlapping source/LEV supports and new boundaries mean these results cannot be compared directly with the prior closed-graph run.
Unmeasured exchange parameters are shared: D=0.1 m²/s by default; reciprocal door pumping 350 m³/h when open and 2 m³/h when closed; closed-door effective leakage 0.006 m² per pair; envelope leakage 0.03 m² per fixed x-strip; vestibule envelope leakage 0.01 m². These are model inputs, not field measurements. D controls interior mixing, cassette-joint exchange and rear-envelope exchange together; its sensitivity is not an isolated test of interior turbulence.
Pressure is solved separately for each geometry: three interior pressure regions in A, one in the open B/B′ interiors, plus the vestibules. The default P10 terminal balance, calm weather and equal temperature give zero net pressure-driven inter-room flow. Tracer still exchanges through explicit diffusion, joint leakage and assumed door pumping. Spatial transport uses conservative potential flow, upwind advection and diffusion in the same three height bands. This is a reduced model, not CFD or measured scent.
| Alternative | Fixed region 1 | Fixed region 2 | Fixed region 3 | Baseline72-seat middle-band mean (beforeF1b) |
|---|---|---|---|---|
| A / 72 | 1022.86 | 2.36 | 0.14 | 312.40 |
| B′ / 72 | 652.91 | 236.02 | 115.03 | 287.40 |
| B / 72 | 652.24 | 235.96 | 115.08 | 287.27 |
Periodic-cycle integrated C* (seconds), default 250 mm grid. Fixed regions are x=0–6, 6–12 and 12–18 m, averaged by interior air volume across all three bands. They are reporting regions, not enclosed rooms in B/B′. The last column is the original pre-F1b seat-position reference in the1.10–2.20m band; moved-seat sampling is recomputed in the current F1b results above. A/B changes the whole arrangement; only B/B′ uses matched seat positions. Neither metric is a preference or breathing-height prediction.
A’s second and third regions are now nonzero through explicit paths. Their small values are conditional on the closed-cassette and outside-mixing assumptions. Across the A leakage-area sensitivity, region 2 changes from 0.36 to 20.28 integrated C* s. A low value does not establish odour-free space or successful separation.
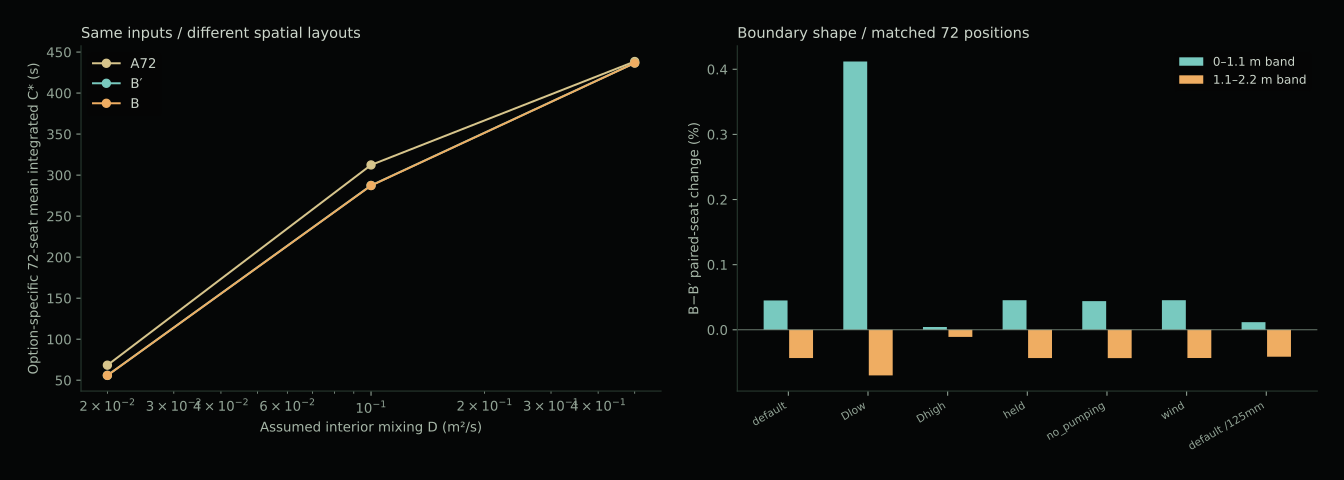
No resolved curvature advantage. At the same 72 positions, B−B′ is -0.043% / -0.041% in the middle band and +0.045% / +0.012% in the lower band, on the 250 / 125 mm grids. The signs differ by height; the absolute middle-band mean shifts 2.42% with grid refinement. Mixing assumptions change it much more.
The exterior routing mattered. An earlier implementation incorrectly returned rear-envelope exchange to the front reservoir. With only that connection changed back for an A diagnostic, regions 2 / 3 become 4.57 / 2.35, versus 2.36 / 0.14 in the corrected default (integrated C* s). This controlled difference is not a measured pathway percentage. The corrected comparison uses clean far exterior for all three designs.
Twenty-four direct runs cover all three shapes at D=0.02, 0.1 and 0.5 m²/s, doors held open for the first 300 seconds, zero imposed door pumping, an imposed +1/0/−1 Pa outer-door pressure pattern, and the finer default grid. The total includes two A-only runs that vary joint leakage area and the single A rear-return diagnostic. These selected sensitivity cases do not establish a calibrated uncertainty bound. Furniture drag, bodies, thermal plumes, jets, actual wind and odour perception remain unresolved. No ML was trained.
The page starts moving automatically at 20× and repeats indefinitely. No timeline slider or slide sequence. The model is iterated to a stable periodic cycle so the concentration field does not reset to clean air at the seam. A minimum pause control is retained. Changing alternative preserves the same time and camera.
Initial tracer stock is included in the removal ledger: start stock + released mass = captured + other removal + remaining. Percentages restart their accounting at each new cycle; the field continues. The largest periodic field seam is 5.24e-07 in volume-weighted relative L1. All 24 runs preserve non-negative tracer within numerical precision; largest relative mass residual 7.07e-13. The 166 connection/limit/time checks include portal counts, uniform tracer, sealed-room isolation, exterior return, independent pressure under imbalance, an empty-geometry identity test and time-step refinement. The maximum 2-second versus 1-second endpoint difference is 0.130% (volume-weighted L1), larger than the tiny paired curvature signal. This is a sensitivity check, not demonstrated time-step independence.
Selected interior paths follow positive net tracer flux. Paths through the mixed front exterior are omitted because their spatial course is unresolved; their transfer remains in the concentration calculation. Dashed connection segments are assumed interfaces. Arrow speed and line width are schematic; they do not encode velocity or mass share. Fields interpolate 10-second saved states, routes crossfade between 20-second states. Door states are exact scheduled inputs; displayed fields remain temporally sampled. Vestibule stipples show a uniform mean, not a resolved gradient.
EARLIER MOVEMENT CHECKS
Activity 4 / S6 → Activity 5 / S4 → original seat. Both layouts complete the original nominal-body digital cycle with the same furniture arrangement. No further furniture moves were needed for C1.
| Retained baseline checks before V5 motion | B′72 | B72 |
|---|---|---|
| Full cycle / body and chairs restored | 836 states / pass | 836 states / pass |
| Swept body-part and chair checks | 17,170 | 17,170 |
| Five other destination seats occupied | Pass | Pass |
| Further furniture moves / total seats | 0 / 72 seats | 0 / 72 seats |
| C2 choices clear Basic / occupied | 2/24 · 2/24 | 2/24 · 2/24 |
| C2 external-obstacle XY buffer Last tested pass, basic / occupied | 50 / 50 mm | 50 / 50 mm |
| C3 new detours complete Basic / occupied | 0/16 · 0/16 | 0/16 · 0/16 |
| V3 added destinations / basic C1 / F1b origins | 4 / 5 | 4 / 5 |
| V3 added destinations / fixed +5 C1 / F1b origins | 3 / 5 | 3 / 5 |
C2 retains two complete choices with the same direction pattern at 550/700 mm offsets. Its 50 mm passing buffer applies only to the mover against external static obstacles; it is not whole-cycle body/chair clearance. Full C2 evidence remains in the research record.
The seat centres are 1.405 m apart. The 0.221 m release-pad route excludes chair handling, rising, entry, sitting and return.
Digital checks only; no human pilot has been completed. A positive minimum clearance for the entire C1 cycle has not been established. Retained nominal-eye-height sightline masks retain 3/3 peers both with three origin peers and with five additional target occupants. The earlier 2/3 figure used a full-room occlusion proxy; none of these rays demonstrates conversation.
C1 tests proximity and return. It is not the lower-exposure move: maximum stationary AUC ratios are 0.9616 / 0.9618 for B′ / B. The 100 mm local bypass margin from the longer F1b route does not apply to C1. No participation or scent advantage from the curved boundary is established.
Both B′72 and B72 retain 72 seats, the identical F1b furniture revision and blue D2 ducts. Activity 6 moves 650 mm west and Activity 5 moves 100 mm west in both. On the longer F1b lower-exposure route, the local standing bypass reaches a 100 mm buffer without the earlier 75° turn; this is not a whole-route comfort or clearance claim.
The automatic loop is the uncalibrated D1 reference field. D2 pressure and outlet conditions have not been recomputed; three ceiling penetrations per layout, junctions and supports remain unresolved.
Duct drawings · Airflow method · Model lab · C1 field kit · Full-journey field kit
HISTORICAL BASELINES / BEFORE F1b WHERE LABELLED
These dated records explain the design sequence. Their baseline values are not current F1b or C1 results.
Historical baseline: furniture positions and numerical results in this section precede F1b. Use the current entry and return results above for the revised B′/B layout.
PREVIOUS SELECTION / TWO DIFFERENT REASONS TO STEP BACK
A nearby visual connection and a lower modelled exposure are different choices. The staged body/chair follow-up is reported above; these are the original seat-selection results.
The original strict test still returns zero combined candidates. Here we separate P4’s wish to step back within sight from P2’s wish for less exposure. Stepping back here means changing to another table; perceived privacy or relief has not been demonstrated. Only initial groups passing all four chair-release checks enter this comparison. The five earlier Back_1 failure cases are excluded.
Scent identity and individual preference remain unknown. A tracer result cannot certify this request.
Compare the moving person’s destination with their own original seat. The existing 0.5 reference is illustrative, not a sensory tolerance.
P3’s four-at-one-surface condition is given up during every withdrawal. P4 may keep visual reference to the group; conversation and participation remain untested.
These selections retain the board for all four people and clear head-reference rays in both directions between the withdrawn person and each of the three remaining people. They use the existing ≤12 m pad-route allowance. The example is selected by the shortest pad route; exposure only breaks equal-length ties. The exposure ratio below belongs to P4; it does not establish P2’s acceptable scent.
| Option / exact departing seat → destination | One-way pad leg / seat separation | Maximum relative AUC† | Mutual peers / board |
|---|---|---|---|
A72Z1_Seat_32 → Z1_Seat_33 | 0.50 m pad leg 1.74 m seat-centre separation 1.00 m pad round trip | 0.9416 | 3/3 Clear |
B′72B_Activity_2_S3 → B_Activity_3_S1 | 0.27 m pad leg 1.51 m seat-centre separation 0.54 m pad round trip | 0.9316 | 3/3 Clear |
B72B_Activity_2_S3 → B_Activity_3_S1 | 0.27 m pad leg 1.51 m seat-centre separation 0.54 m pad round trip | 0.9318 | 3/3 Clear |
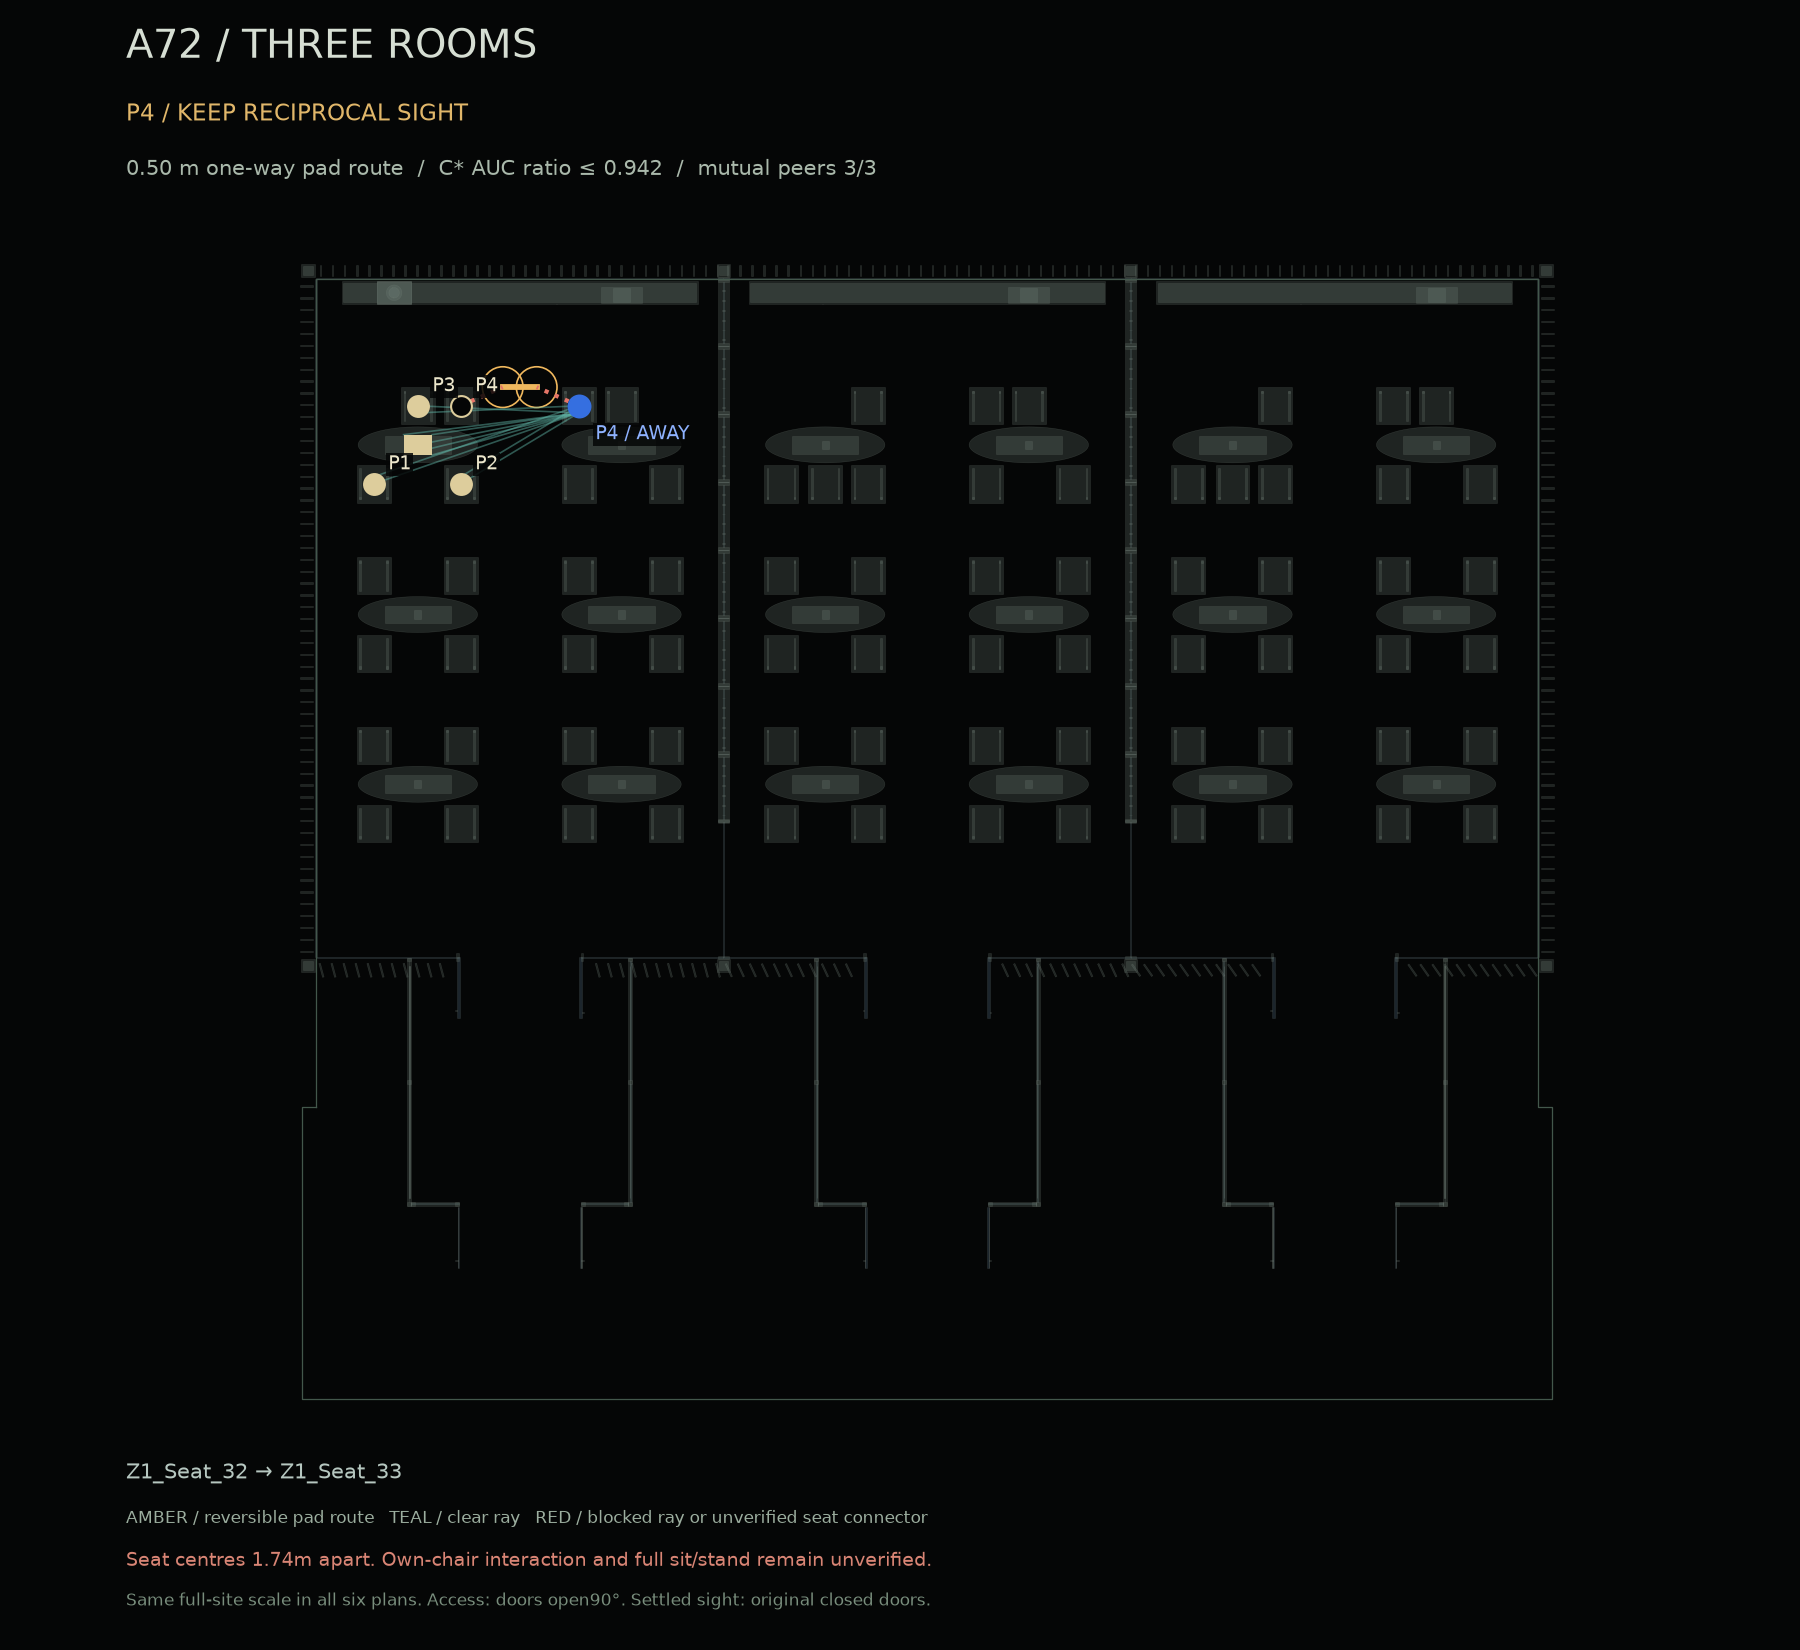
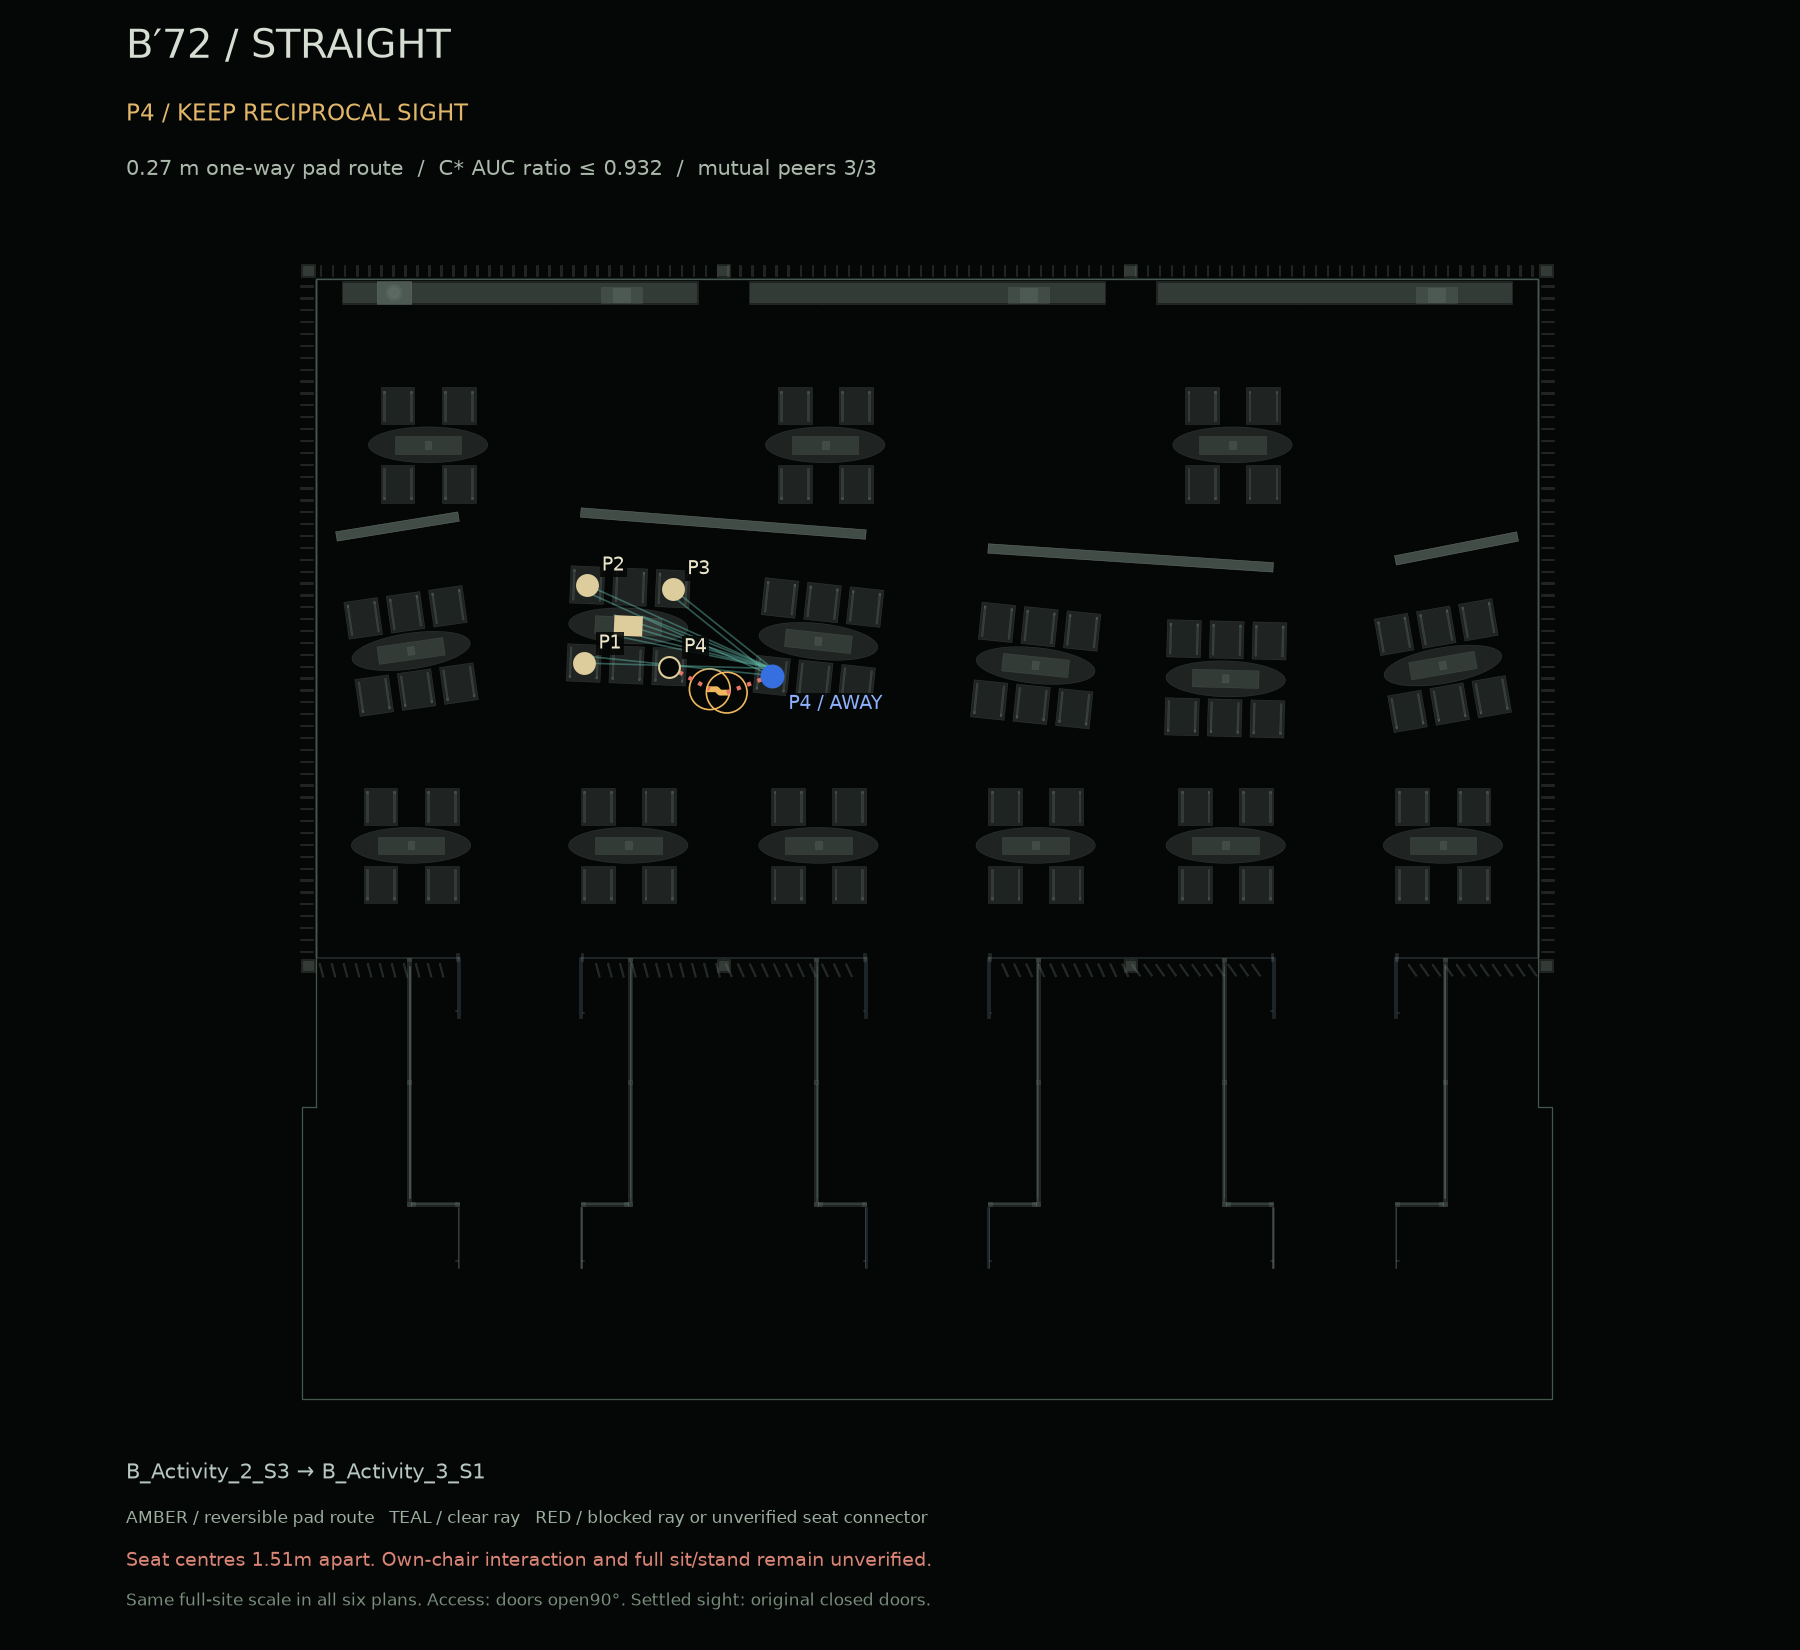
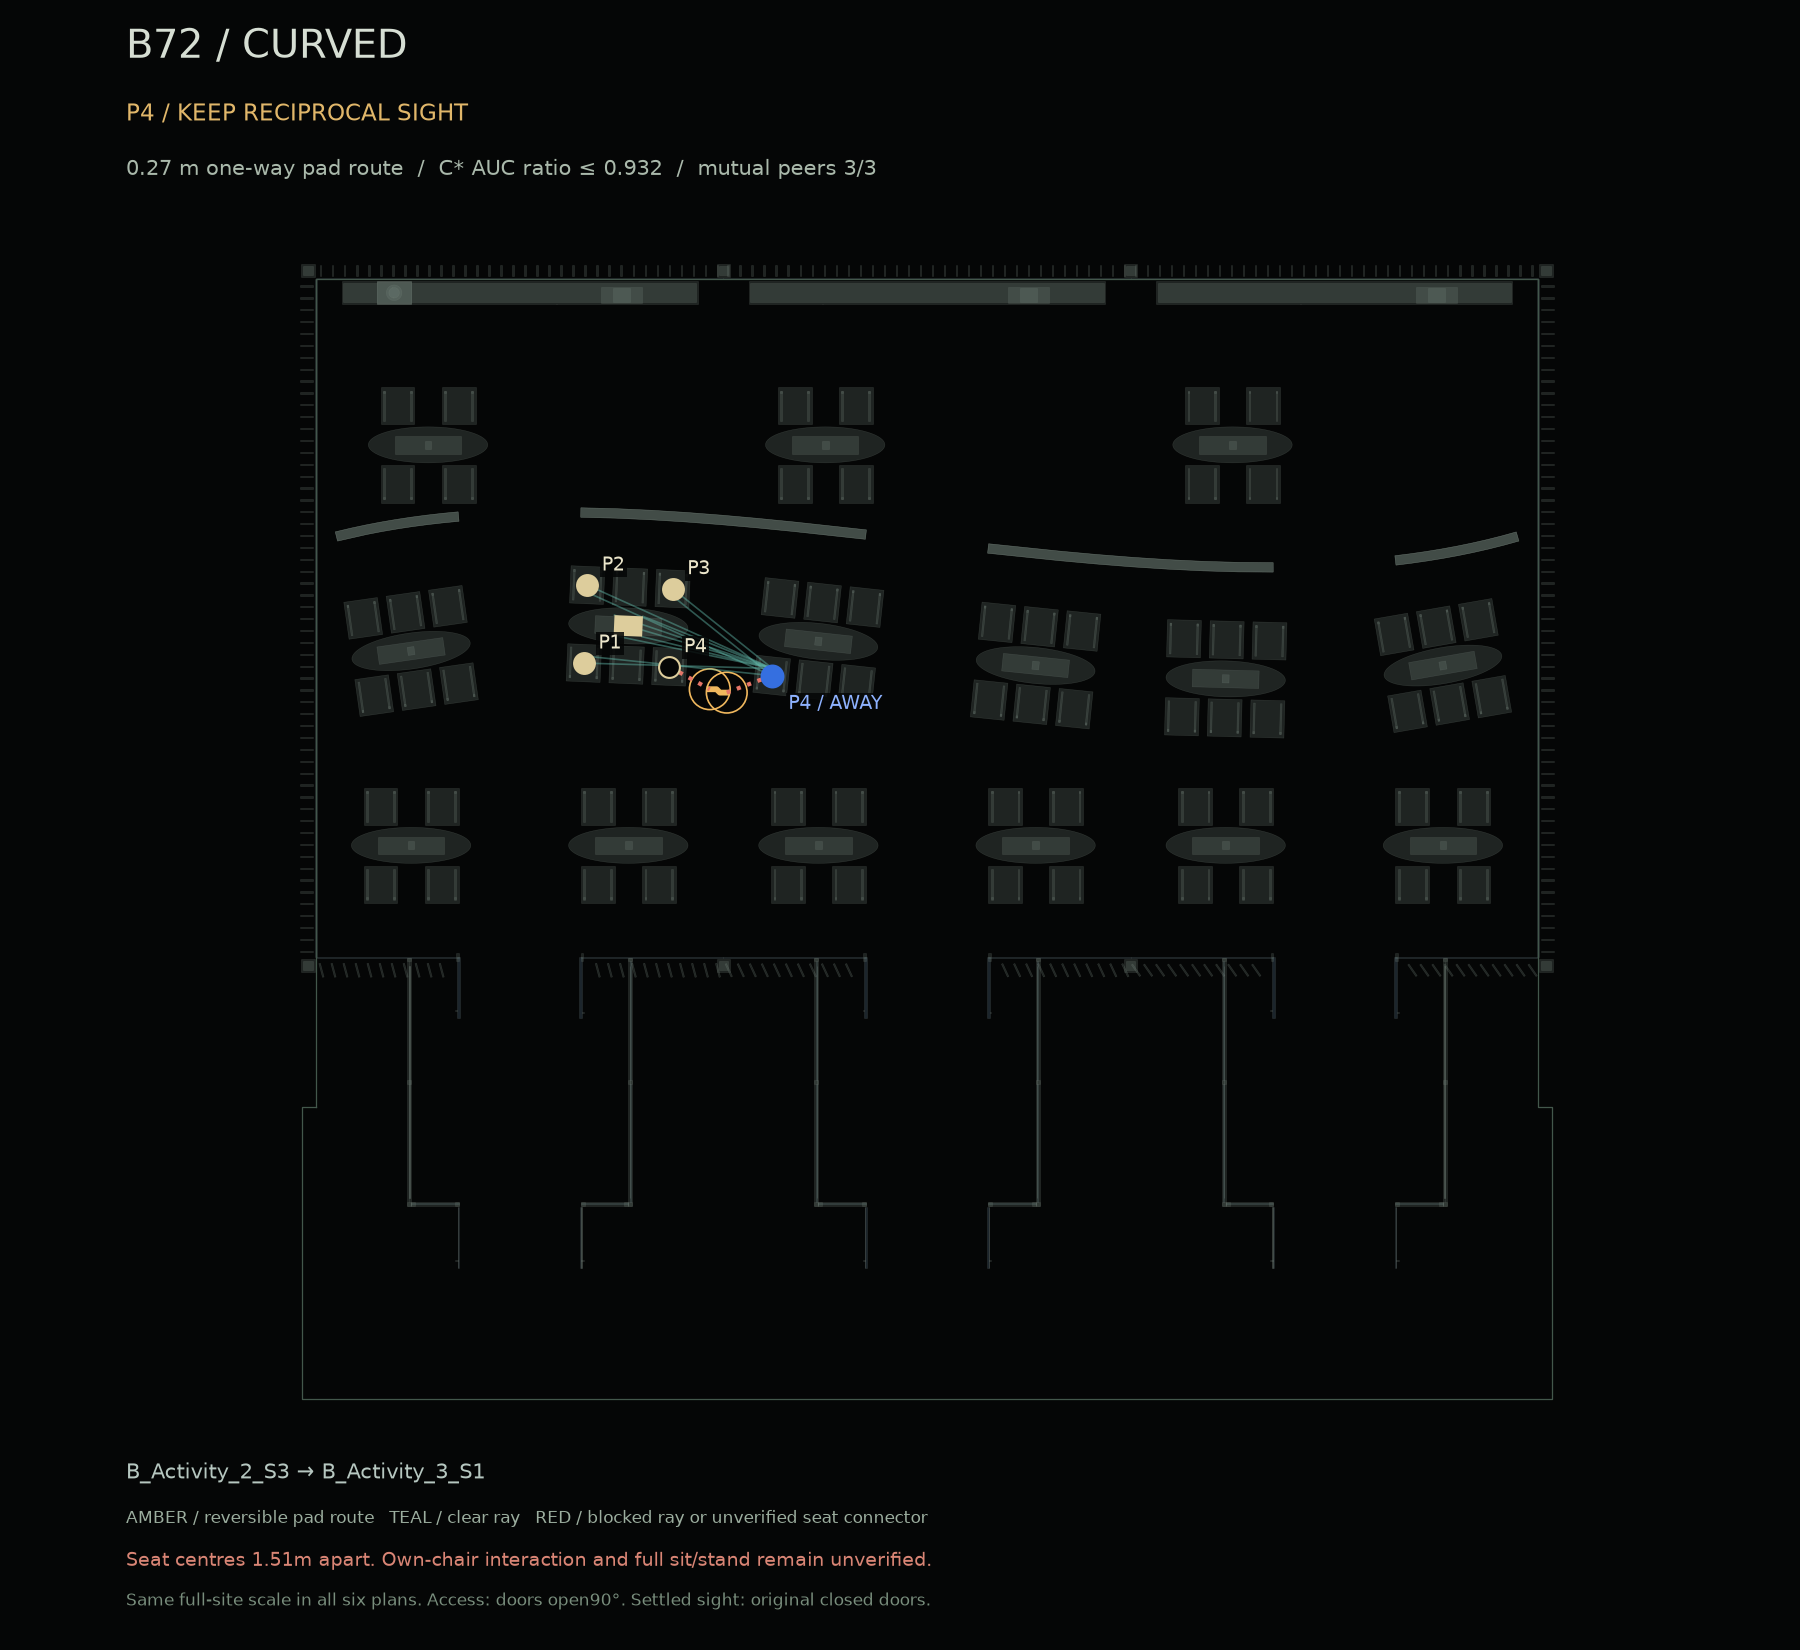
Initial-group-qualified contact scenarios (allocations and directed moves, not independent participants or a design success rate): A72 120 / B′72 372 / B72 366. Remaining torso footprints fit entirely inside obstacles already avoided by these paths.
These additional contact-preserving points are the lowest-ratio options within the same 12 m pad allowance. They are an optional second objective, not the distance required to maintain contact.
| Variant / route | Pad leg | Maximum ratio |
|---|---|---|
A72 / Z1_Seat_31 → Z1_Seat_34 | 3.00 m | 0.9067 |
B′72 / B_Activity_2_S2 → B_Activity_6_S1 | 11.35 m | 0.6830 |
B72 / B_Activity_2_S2 → B_Activity_6_S1 | 11.35 m | 0.6832 |
All three layouts offer an adjacent-table visual connection with little relative exposure change. The short amber leg starts and ends beside the chairs: it is not the whole walk. Seat-centre separation is reported separately. B′72 and B72 use the same selected seats and path; their small tracer-ratio difference does not establish a curvature benefit. Visibility alone does not demonstrate readable work or conversation.
A72’s shortest option meeting the existing 0.5 reference changes rooms through the forecourt and four door interfaces. B′72 and B72 have no reachable option meeting 0.5 after the initial four-seat checks. Their rows therefore show the lowest available maximum ratio, explicitly as a concession. P4 stays with the group in this scenario.
| Option / exact departing seat → destination | One-way pad leg / seat separation | Maximum relative AUC† | Mutual peers / board |
|---|---|---|---|
A72Z1_Seat_04 → Z2_Seat_03 | 17.06 m pad leg 4.26 m seat-centre separation 34.11 m pad round trip | 0.0136 | 0/3 Glass-conditional / blocked |
B′72B_Activity_2_S4 → B_Activity_6_S3 | 16.60 m pad leg 13.43 m seat-centre separation 33.19 m pad round trip | 0.6280 | 2/3 Clear |
B72B_Activity_2_S4 → B_Activity_6_S3 | 16.60 m pad leg 13.43 m seat-centre separation 33.19 m pad round trip | 0.6284 | 2/3 Clear |
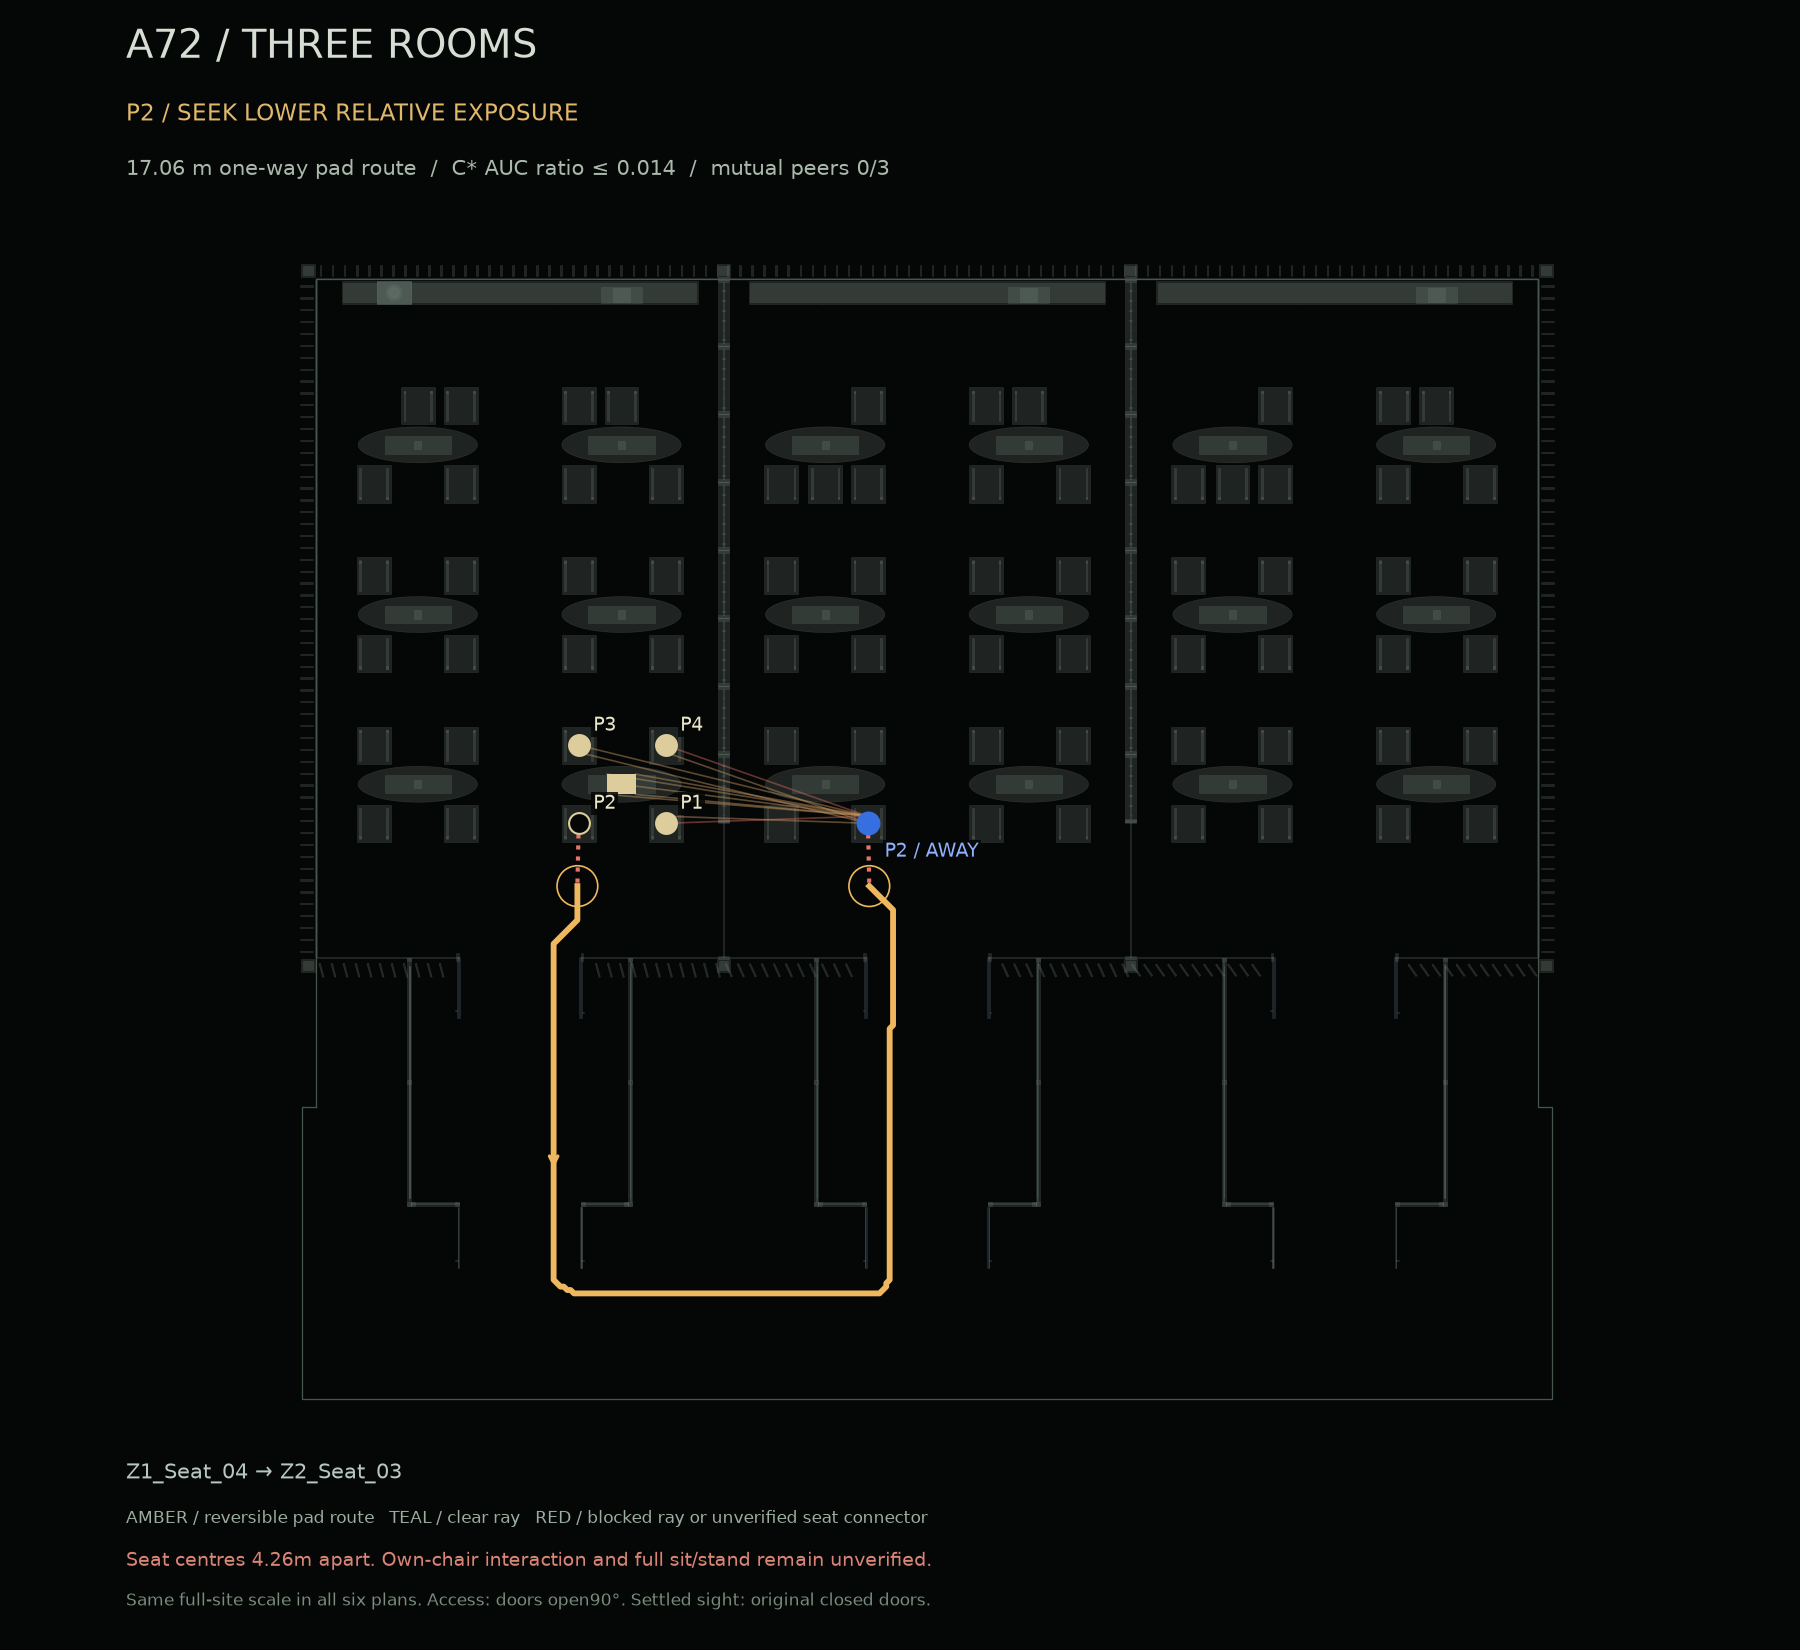
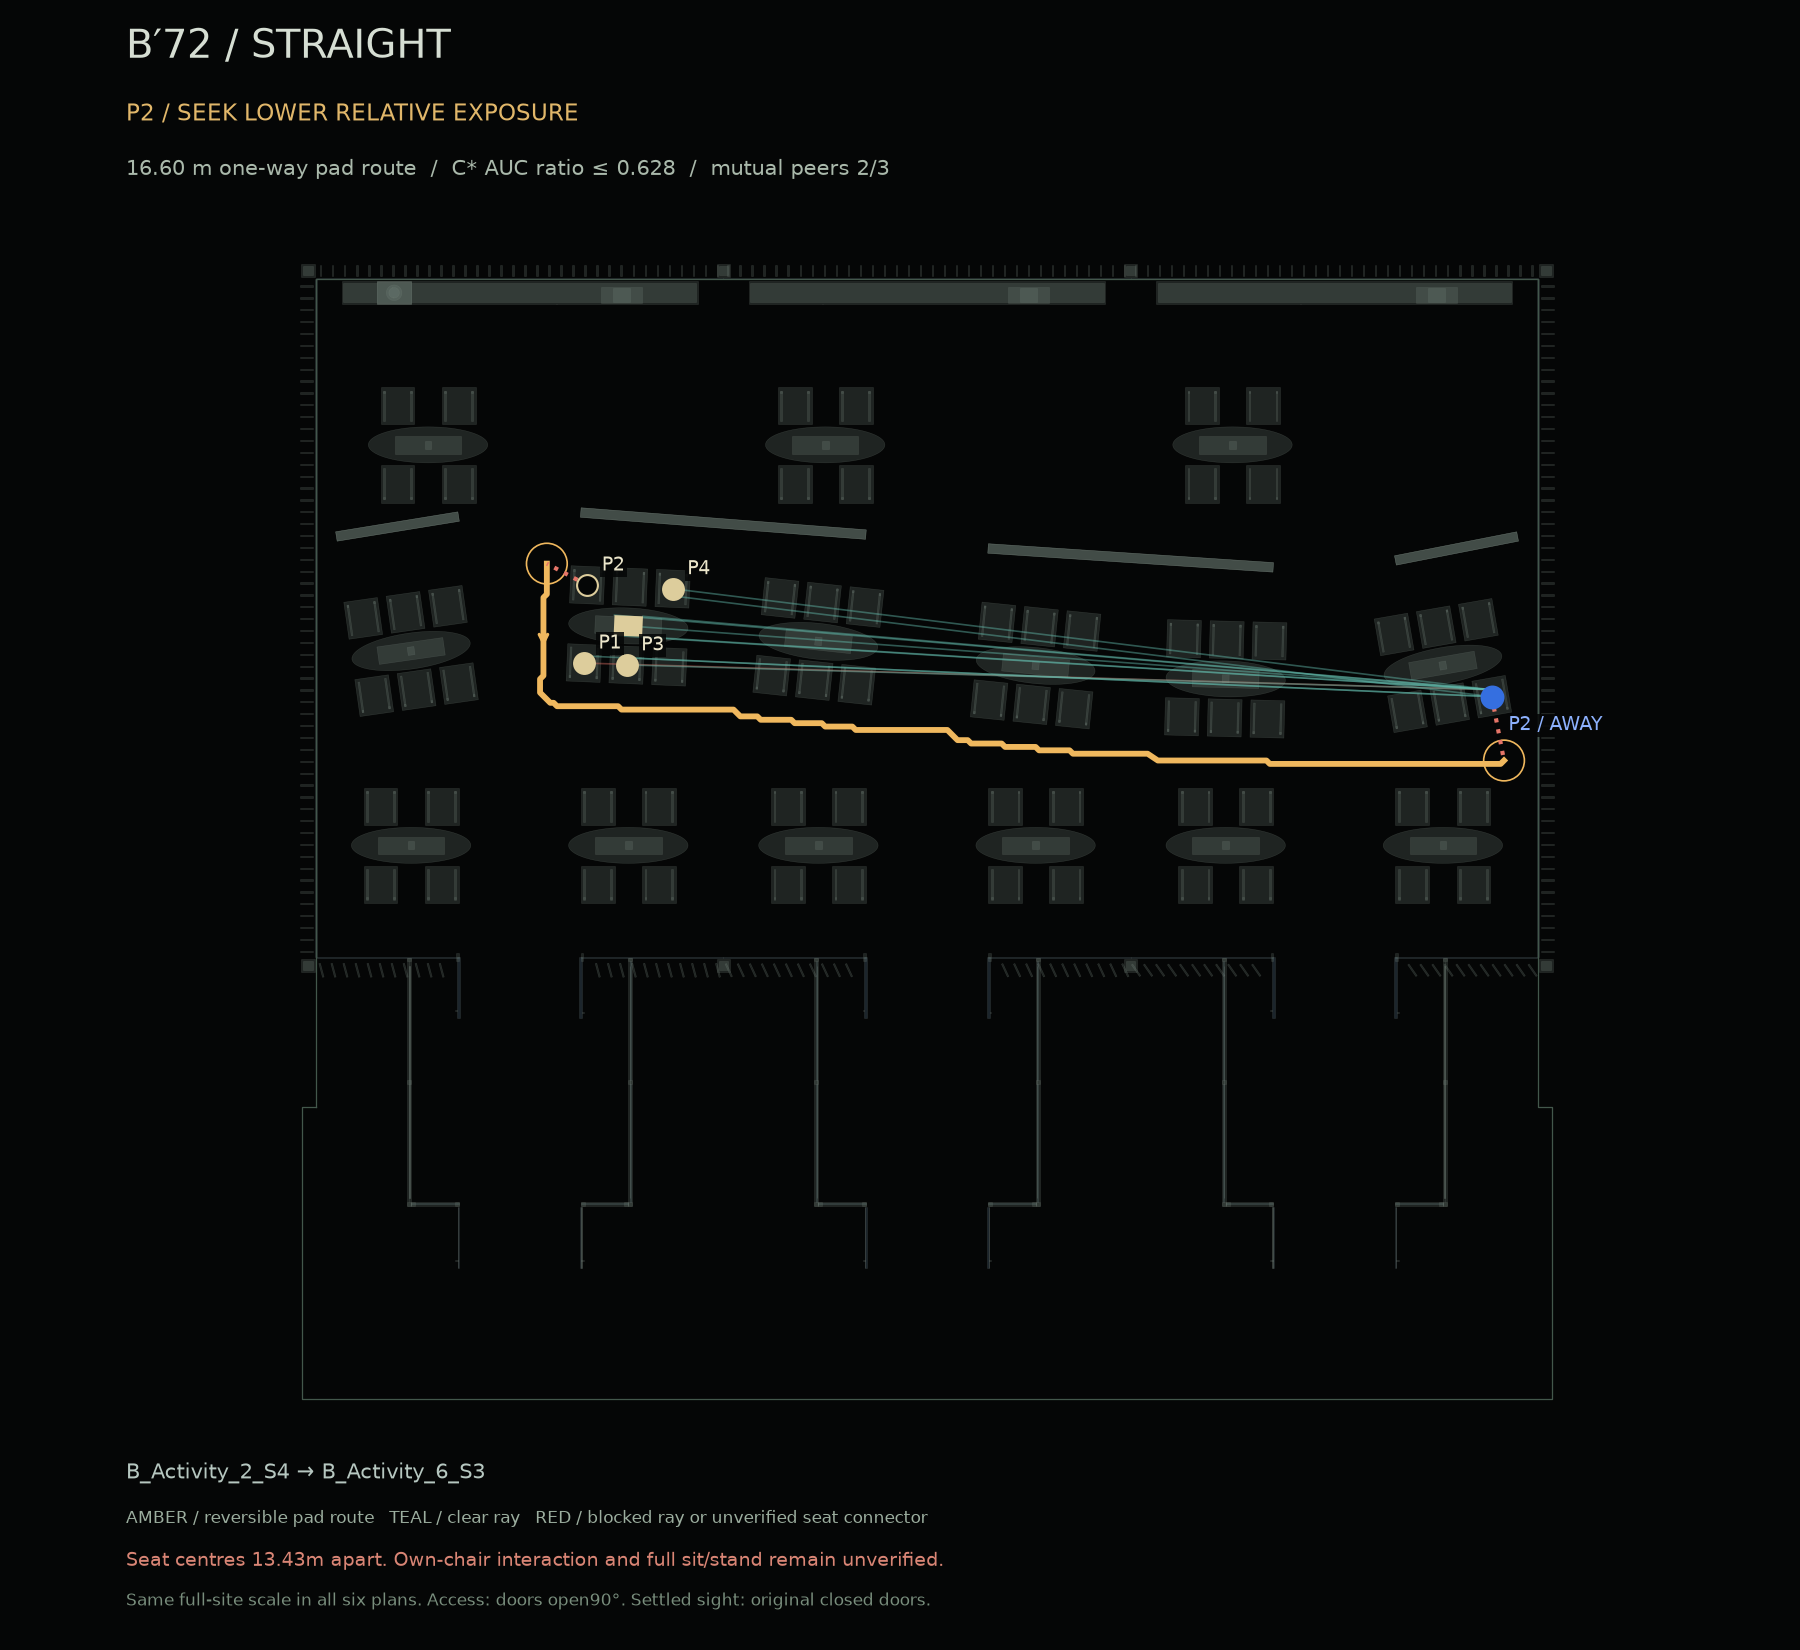
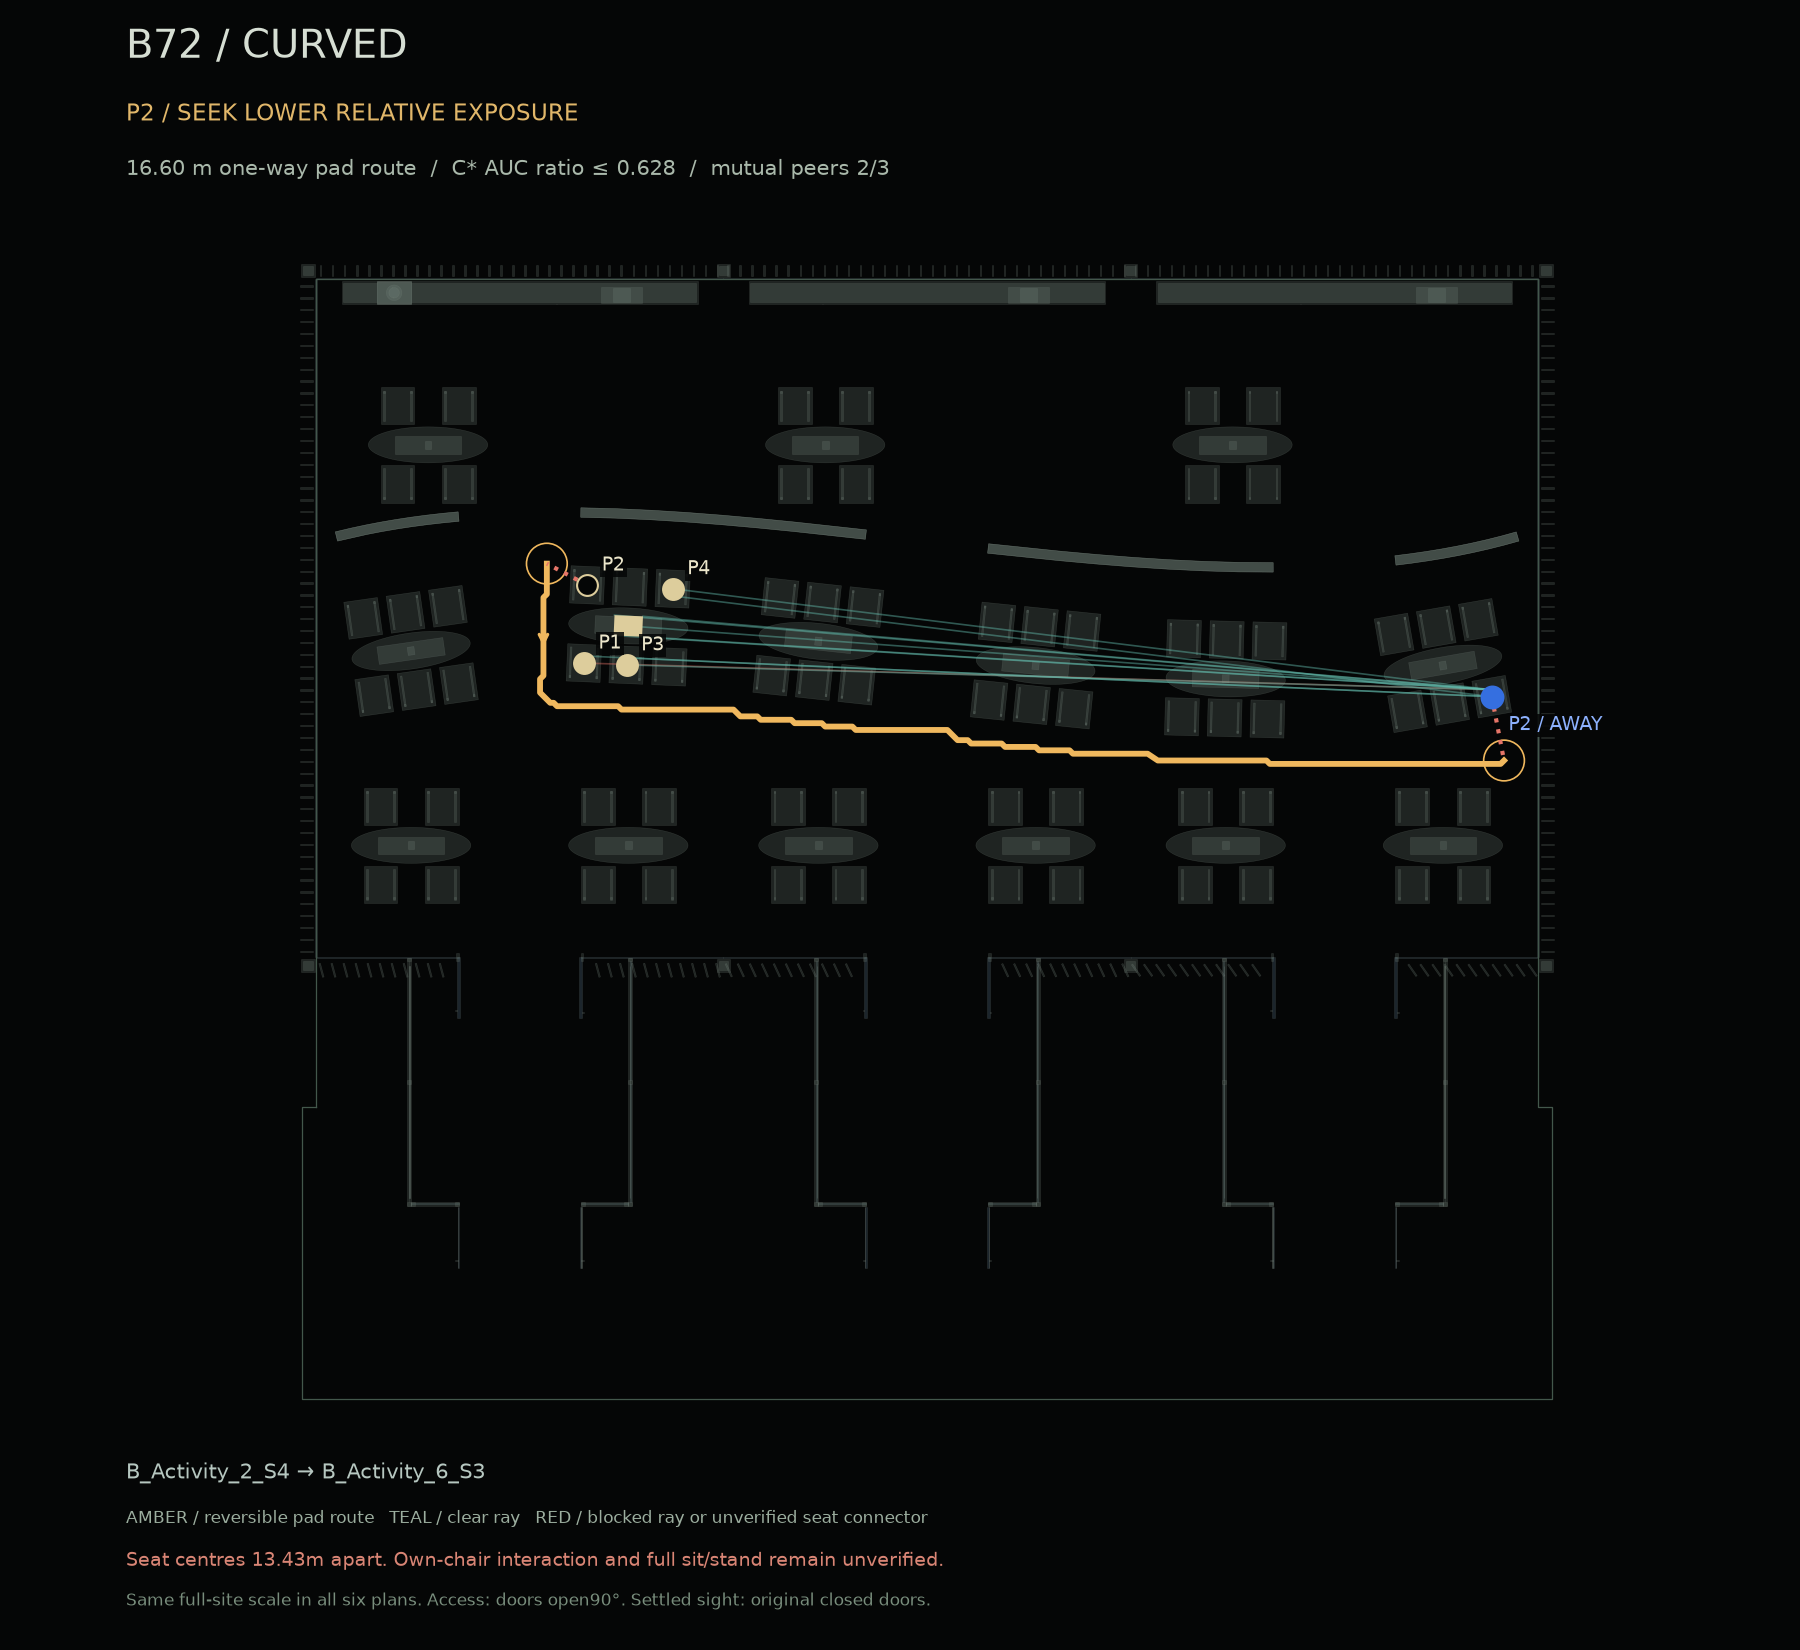
A72 exposure option: the extra low/high cassette-leak cases give a maximum ratio 0.0293, compared with0.0136 in the seven common cases. Both are model sensitivities.
† Maximum destination / departing person’s own-seat tracer AUC across both height bands and all seven common saved cases. Same source and ventilation assumptions; not scent intensity, liking or a measured personal tolerance. Different profiles can start from different four-seat allocations. No new flow solve or ML training.
The amber routes connect clear standing pads. The red dotted seat connectors are separate: the conservative 450 mm straight envelope clears other furniture and the three remaining bodies in every displayed option and every nondominated candidate. Its overlap is with the moving person’s own pulled chair. This is an indeterminate chair–body interaction, not an established access failure. A straight full-height footprint cannot represent the staged rise and turn around the chair; that earlier screen did not test the movement. See the current staged study above.
Return uses the same pad route in reverse under fixed furniture and open-door assumptions. The destination must be vacant before departure and the original seat reserved. Installed capacity remains 72; reserving both positions temporarily leaves one fewer seat available to others. Door operation, queues, movement exposure and simultaneous departures remain unverified. Settled sightlines use nominal closed doors; this is not one time-coupled movement/airflow simulation.
P1 Z1_Seat_25 · P2 Z1_Seat_27 · P3 Z1_Seat_31 · P4 Z1_Seat_32
Scent identity/preference unverified P2 stays at the group. The reported relocation ratio belongs to P4; it cannot establish P2's acceptable scent. Four-at-one-work-surface is given up during withdrawal 3/3 reciprocal head-reference pairs; board clear; pad path 0.50m Other-furniture/body envelope clear; own-chair interaction and sit/stand unverified 72 installed seats; destination must be vacant and origin reserved, reducing seats available to others by one during withdrawal
P1 Z1_Seat_06 · P2 Z1_Seat_04 · P3 Z1_Seat_10 · P4 Z1_Seat_12
Scent identity/preference unverified 0.5 reference met for this relocation only Four-at-one-work-surface is given up during withdrawal P4 stays at the group. This option tests P2's withdrawal, not satisfaction of P4's own wish to step back. Other-furniture/body envelope clear; own-chair interaction and sit/stand unverified 72 installed seats; destination must be vacant and origin reserved, reducing seats available to others by one during withdrawal
P1 B_Activity_2_S1 · P2 B_Activity_2_S4 · P3 B_Activity_2_S6 · P4 B_Activity_2_S3
Scent identity/preference unverified P2 stays at the group. The reported relocation ratio belongs to P4; it cannot establish P2's acceptable scent. Four-at-one-work-surface is given up during withdrawal 3/3 reciprocal head-reference pairs; board clear; pad path 0.27m Other-furniture/body envelope clear; own-chair interaction and sit/stand unverified 72 installed seats; destination must be vacant and origin reserved, reducing seats available to others by one during withdrawal
P1 B_Activity_2_S1 · P2 B_Activity_2_S4 · P3 B_Activity_2_S2 · P4 B_Activity_2_S6
Scent identity/preference unverified 0.5 reference not met; no acceptable-scent claim Four-at-one-work-surface is given up during withdrawal P4 stays at the group. This option tests P2's withdrawal, not satisfaction of P4's own wish to step back. Other-furniture/body envelope clear; own-chair interaction and sit/stand unverified 72 installed seats; destination must be vacant and origin reserved, reducing seats available to others by one during withdrawal
P1 B_Activity_2_S1 · P2 B_Activity_2_S4 · P3 B_Activity_2_S6 · P4 B_Activity_2_S3
Scent identity/preference unverified P2 stays at the group. The reported relocation ratio belongs to P4; it cannot establish P2's acceptable scent. Four-at-one-work-surface is given up during withdrawal 3/3 reciprocal head-reference pairs; board clear; pad path 0.27m Other-furniture/body envelope clear; own-chair interaction and sit/stand unverified 72 installed seats; destination must be vacant and origin reserved, reducing seats available to others by one during withdrawal
P1 B_Activity_2_S1 · P2 B_Activity_2_S4 · P3 B_Activity_2_S2 · P4 B_Activity_2_S6
Scent identity/preference unverified 0.5 reference not met; no acceptable-scent claim Four-at-one-work-surface is given up during withdrawal P4 stays at the group. This option tests P2's withdrawal, not satisfaction of P4's own wish to step back. Other-furniture/body envelope clear; own-chair interaction and sit/stand unverified 72 installed seats; destination must be vacant and origin reserved, reducing seats available to others by one during withdrawal
Role-to-seat assignment is an explicit hypothetical scenario, not a measured preference-based allocation. Initial geometry conditions pass, while full bodily transfer remains unresolved.
| Variant / chair | Maximum clear pull | Shortfall to declared 300 mm pull |
|---|---|---|
B′72 / B_Back_1_S1 | 241.8 mm | 58.2 mm |
B′72 / B_Back_1_S2 | 137.6 mm | 162.4 mm |
B72 / B_Back_1_S1 | 209.7 mm | 90.3 mm |
B72 / B_Back_1_S2 | 137.0 mm | 163.0 mm |
B72 / B_Back_2_S1 | 262.5 mm | 37.5 mm |
These values use the existing pull direction and collision envelope. They are not instructions to move a wall by that amount. Any later furniture change must be applied equally to B′ and B and recorded as a new comparison condition.
No combined score was used. We retain nondominated alternatives across relative exposure, route length, doors, outdoor passage, board visibility and reciprocal peer count. The contact example minimises pad-route length among reciprocal-contact routes ≤12 m; relative AUC only breaks equal-length ties. The exposure example uses the shortest route meeting 0.5 when available; otherwise it shows the smallest ratio and reports failure of 0.5. All criteria and unresolved transfers remain visible.
Historical baseline: furniture positions and numerical results in this section precede F1b. Use the current entry and return results above for the revised B′/B layout.
PREVIOUS / STRICT COMBINED TEST AND FAILURE DIAGNOSIS
No candidate meets all the declared exposure, route and visual-contact conditions. The useful result is where each layout asks people to compromise.
We checked every four-seat allocation, every departing person and every seat at another table: 57,312 scenarios. These are digital geometry tests of hypothetical demands, not observed people or satisfaction. The 72 seats and existing physical geometry stay fixed.
| What was checked | A72 | B′72 | B72 |
|---|---|---|---|
| Initial shared-task vision only* | 16 / 18 | 63 / 99 | 63 / 99 |
| Tables with a vision-only combination | 16 / 18 | 15 / 15 | 15 / 15 |
| Vision + release pads at all four starting seats | 16 / 18 | 15 / 99 | 15 / 99 |
| Tables offering the joined condition | 16 / 18 | 11 / 15 | 11 / 15 |
| Already-seated diagnostic: half-exposure + ≤12 m legs** | 0 | 5 | 5 |
| Also requiring release pads for all four starting seats | 0 | 0 | 0 |
| Among diagnostic routes: board + all three peers visible from the withdrawn seat | 0 | 0 | 0 |
* All five board points and three head-centre reference points, 1.20 m eye, ±100° declared viewing allowance, four assumed bodies. This is not a success rate: table capacities and combination counts differ. ** Candidate / departing person’s own-seat AUC ≤0.5 in both height bands across all seven common saved cases; 600 mm walking disc. These five are diagnostic pad-to-pad segments from a presumed seated group. All five fail the additional all-four starting-release condition; they are not five usable group arrangements or verified seated-to-seated walks.
Room separation offers modelled exposure contrasts. The shortest computed cross-room circulation leg is 17.06 m, through four door interfaces and the existing forecourt. No half-exposure candidate fits the declared 12 m leg limit. Withdrawal gives up proximity to the shared work surface.
The rear-row diagnostic keeps the board and two peer reference points visible, but its starting table fails the release check at S1/S2. Its circulation leg is 10.04 m; adding straight seat-to-pad connectors gives an optimistic 11.36 m for this computed route. Standing up and sitting down remain unverified.
B has the same five already-seated diagnostic cases; none survives the all-four starting-release check. Curvature changes some rays and one chair-pull collision, but does not resolve the missing third peer or the shared-table conflict. No preference or participation advantage from the curve is established.
A72 passes at 16 tables. Z2_Table_0_2 and Z3_Table_0_2 place three people along one side; the middle head blocks the outer pair. B′/B’s six activity tables each have nine passing four-seat allocations: two seats on each side. Their nine four-seat tables pass with all four seats. A 3+1 allocation at an activity table fails the head-reference criterion.
These are vision-only counts. Joining the release-pad check at all four seats leaves A 16 combinations at 16 tables, and B′/B 15 combinations at 11 tables for the 600 mm disc. At 900 mm the joined counts are 0 / 13 / 13 at 0 / 9 / 9 tables. The numerical order changes with the walking-disc assumption; these counts do not rank design quality. Free pads are a necessary geometric condition, not a validated sit/stand movement. All joined allocations and failed seats ↗ The same initial vision-only counts occur at 1.10, 1.20 and 1.30 m eyes with the ±100° allowance. Rays at 1.10 m can be coplanar with the 1.10 m boundary top; those grazing cases are numerically ambiguous and do not support a curvature claim. The primary result uses 1.20 m. At ±60°, none meets the strict all-three-peers rule: that exposes the need to turn attention sideways, not an inability to work. The model does not establish readable distance, reaching, speech or mutual face orientation.
Vision-only table and seat IDs, including failed allocations ↗In both B′ and B, B_Back_1_S4 → B_Back_3_S3 is the shortest diagnostic half-exposure route retaining the board in view, assuming the group is already seated. The original table’s S1/S2 chair pulls fail, so this is not a qualifying four-person arrangement. The maximum candidate/own-seat ratio is 0.484. At the candidate seat, one of the three remaining people is obscured. With 71 assumed occupants, only one of the three peer reference points remains clear. The destination must be vacant before the move, and the original seat must be reserved for return.
Moving to another table always gives up P3’s strict demand that all four remain at the same work surface. A partial visual connection would require both an accepted change of activity and a starting arrangement where all four can get to and leave their seats. The latter is not established for this diagnostic example. P1’s desired scent and P2’s acceptable scent level are still unknown; tracer reduction cannot settle their preferences.
| From → to | Circulation leg | Leg + straight endpoint chords† | Board / peers clear |
|---|---|---|---|
B_Back_1_S3 → B_Activity_4_S4 | 11.21 m | 12.82 m | Blocked / 2 of 3 |
B_Back_1_S3 → B_Back_3_S3 | 11.52 m | 13.10 m | Clear / 2 of 3 |
B_Back_1_S4 → B_Back_3_S1 | 10.74 m | 12.06 m | Clear / 2 of 3 |
B_Back_1_S4 → B_Back_3_S3 | 10.04 m | 11.36 m | Clear / 2 of 3 |
B_Back_1_S4 → B_Back_3_S4 | 11.52 m | 13.10 m | Clear / 2 of 3 |
† An optimistic endpoint allowance for the computed 50 mm grid route, not a globally shortest continuous path or a verified transfer. Four totals exceed 12 m, including one by only 6 cm. Only the 11.36 m example remains below 12 m on this calculation; it still fails the starting-group release condition, and actual seat transfers remain unverified. Grid refinement and chair movement can change these near-limit classifications. The 900 mm disc leaves two circulation segments within 12 m, with no full visual-contact candidate.
The source is the existing Rhino mesh, including wall thickness, furniture, door leaves, vestibule glass and the forecourt. All layouts retain 180 m² inside; the existing threshold/forecourt adds 118.72 m² to the route domain. No floor area or seat was added. Routes use doors assumed open by 90°; stationary sightlines use nominal closed doors. This does not replace the saved transport simulation’s scheduled doors.
Each endpoint reserves the actual chair footprint pulled back 300 mm, plus a full 600 or 900 mm standing disc. The original chair footprint stays blocked conservatively. A 50 mm routing grid includes a half-cell-diagonal clearance margin. Paths clear geometry up to 1.80 m; they do not model moving bodies, luggage, queues, door opening effort or a full sit/stand manoeuvre. A free release pad is not proof that a person can transfer into it.
At 600 mm, release pads exist for 70 / 58 / 58 seats in A / B′ / B; at 900 mm, 46 / 50 / 50. This is not accessibility or egress certification. B′ has two failed chair pulls (B_Back_1_S1/S2); B has those plus B_Back_2_S1, whose sweep intersects the curve. The additional collision does not change the final pad count.
The task board is 420 × 300 mm, 20 mm above the tabletop. Bodies are declared proxies: 450 × 250 mm torso and 100 mm radius head. Eye heights 1.10 / 1.20 / 1.30 m and ±60° / ±100° view allowances are assumptions. Head-centre visibility is not face recognition; targets exclude their own body but retain intervening bodies. Glass crossings are separate conditional rays. Crowding is a 71-person sightline sensitivity, not a pedestrian simulation.
All 23 valid existing flow runs are reused: seven common cases per layout and two additional A leakage cases. Main ratios use the departing individual’s seat; selected-four means and former whole-table means are retained separately. Thresholds 0.5 / 0.1 / 0.01 and distances 6 / 12 m are illustrative. No strict combined candidate passes any tested setting. B/B′ contact classifications differ in 82 of 26,208 scenarios across tested heights and angles, despite the same main result. Neither a count nor model agreement proves real preference or participation.
A100 → A72 preserves all three rooms, all 18 tables and every retained chair position. Twenty-eight chairs are removed by a fixed rule; each room keeps 24 seats. This separates chair removal from redesign.
A72 → B′72 holds capacity at 72 but changes boundaries, table locations and the table count from 18 to 15. This is a whole-layout comparison, not the effect of a single wall feature.
B′72 → B72 keeps every chair and table position and orientation. B′ consists of four straight chords through the original curved segments’ endpoints. Opening endpoints, 140 mm thickness and 1.10 m height stay fixed. B′ is an experimental control, not an independently optimised design.
| Alternative | Tables | Unoccupied floor* | Boundary length | Boundary footprint | Earlier entry approaches** |
|---|---|---|---|---|---|
| A / 100 | 18 | 130.76 m² | retained assemblies† | 2.654 m² | 100/100 |
| A / 72 | 18 | 138.46 m² | retained assemblies† | 2.654 m² | 72/72 |
| B′ / 72 | 15 | 141.61 m² | 12.080 m | 1.691 m² | 72/72 |
| B / 72 | 15 | 141.61 m² | 12.088 m | 1.693 m² | 72/72 |
* Includes gaps between furniture; not all usable activity area. † A retains articulated panels and louvres; no equivalent total centreline length is claimed. B/B′ lengths refer only to the four new ribbon segments. ** Historical entry-approach metric only; superseded for withdrawal by the full-disc release-pad test above. 600 mm walking disc on a 50 mm grid, then a simplified 240 mm final reach. Not wheelchair, egress or simultaneous movement certification. No added interior area. Original structure, façade, entry system, source and mechanical terminals remain.
The fixed total supply remains 4,680 m³/h, general extract 4,320 and LEV 360. Nominal supply per capacity seat changes from 46.8 to 65.0 m³/h when capacity falls to 72. Capacity is not actual occupancy.
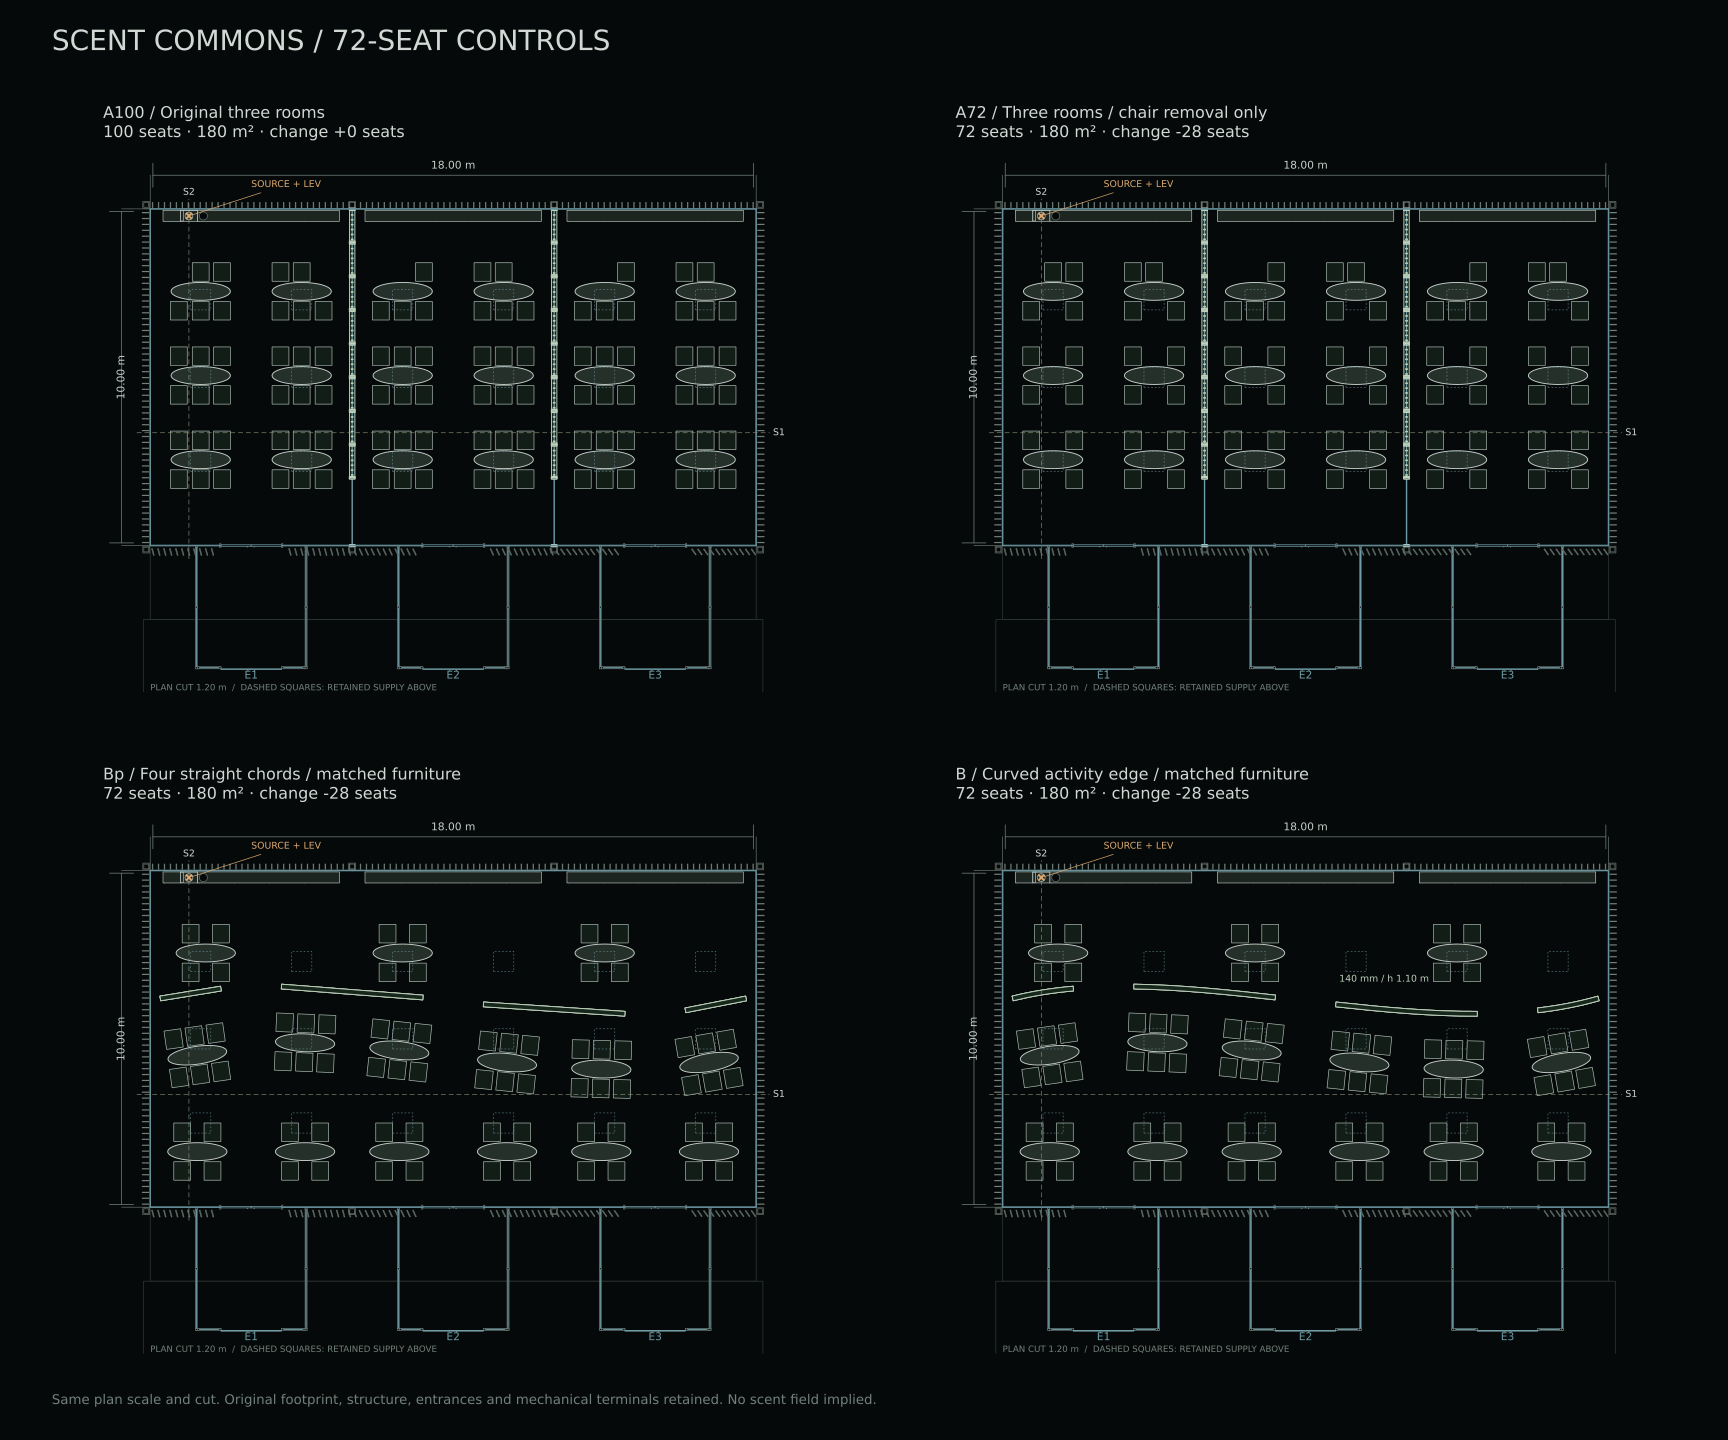
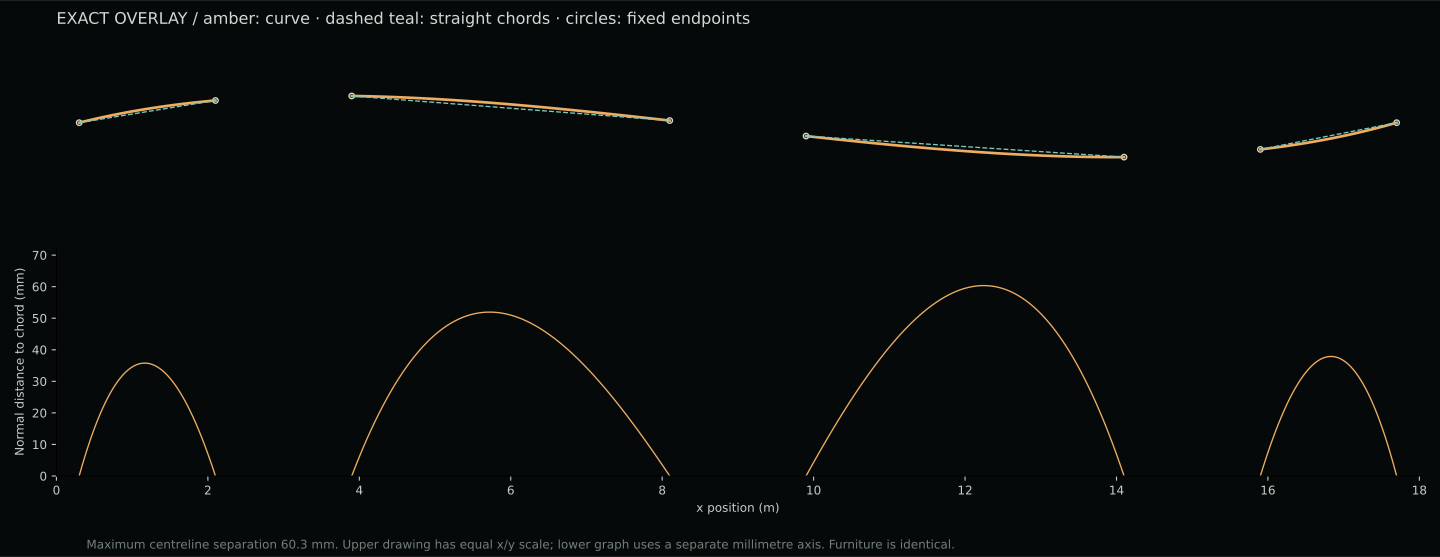
Historical baseline: furniture positions and numerical results in this section precede F1b. Use the current entry and return results above for the revised B′/B layout.
THE COST OF STEPPING BACK / ROUTE + VIEW
Amber lines are computed circulation legs; dotted endpoint connectors remain unverified. Teal rays are clear reference lines, red rays are blocked or outside the declared view. The render aims toward the shared task with a 1.20 m eye and 24 mm lens. Seat locations differ in A; these are task-directed views, not identical world cameras. Ochre figures are assumed body proxies.
Z1_Seat_04 → Z2_Seat_03 · 17.06 m circulation leg · 4 door interfaces
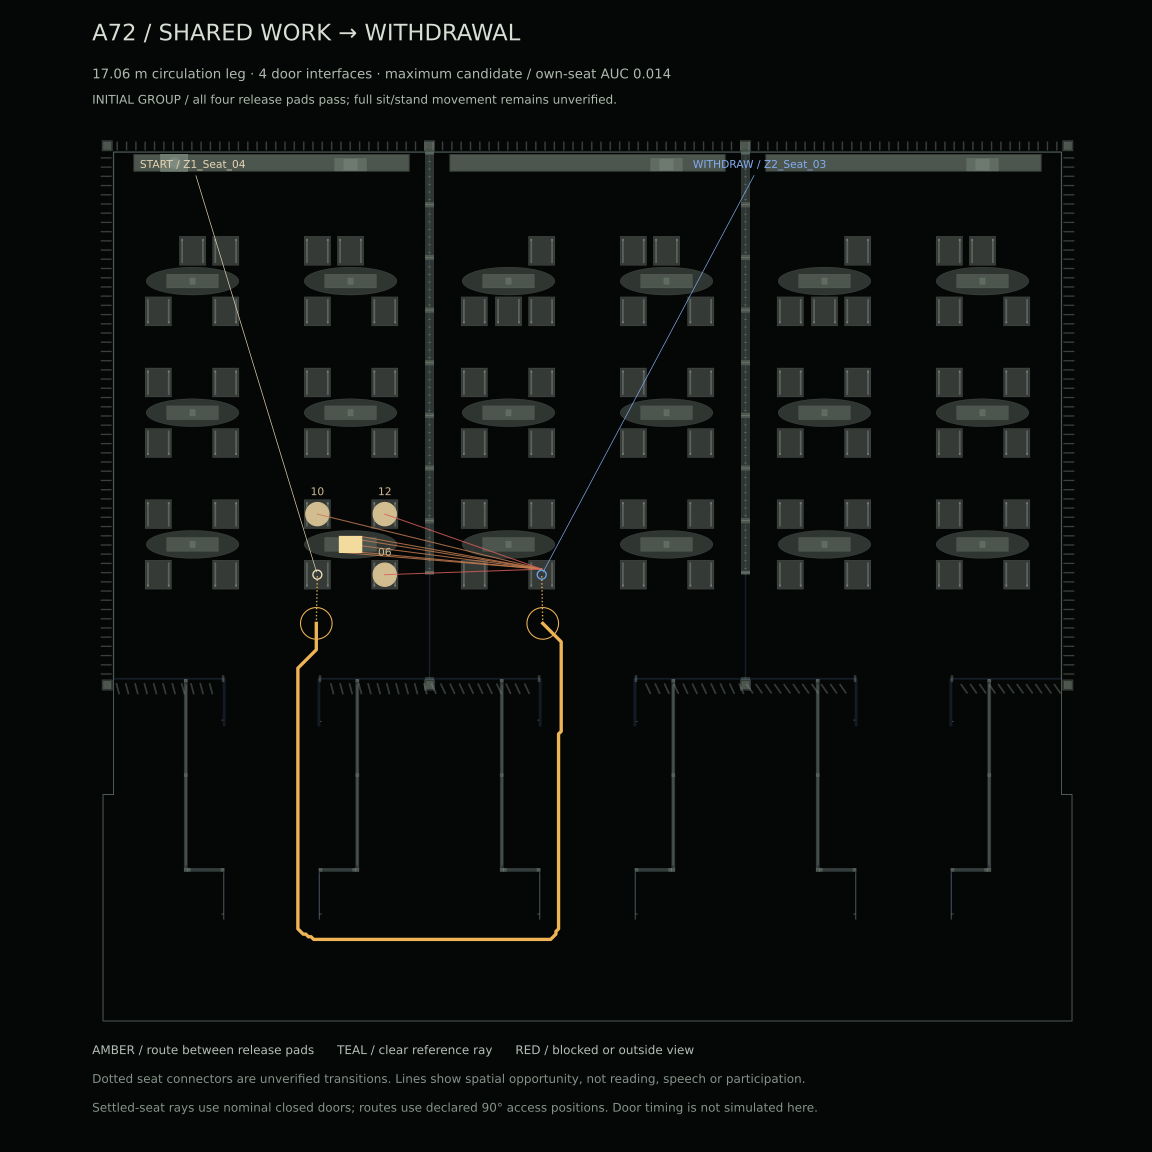
B_Back_1_S4 → B_Back_3_S3 · 10.04 m circulation leg · 0 door interfaces
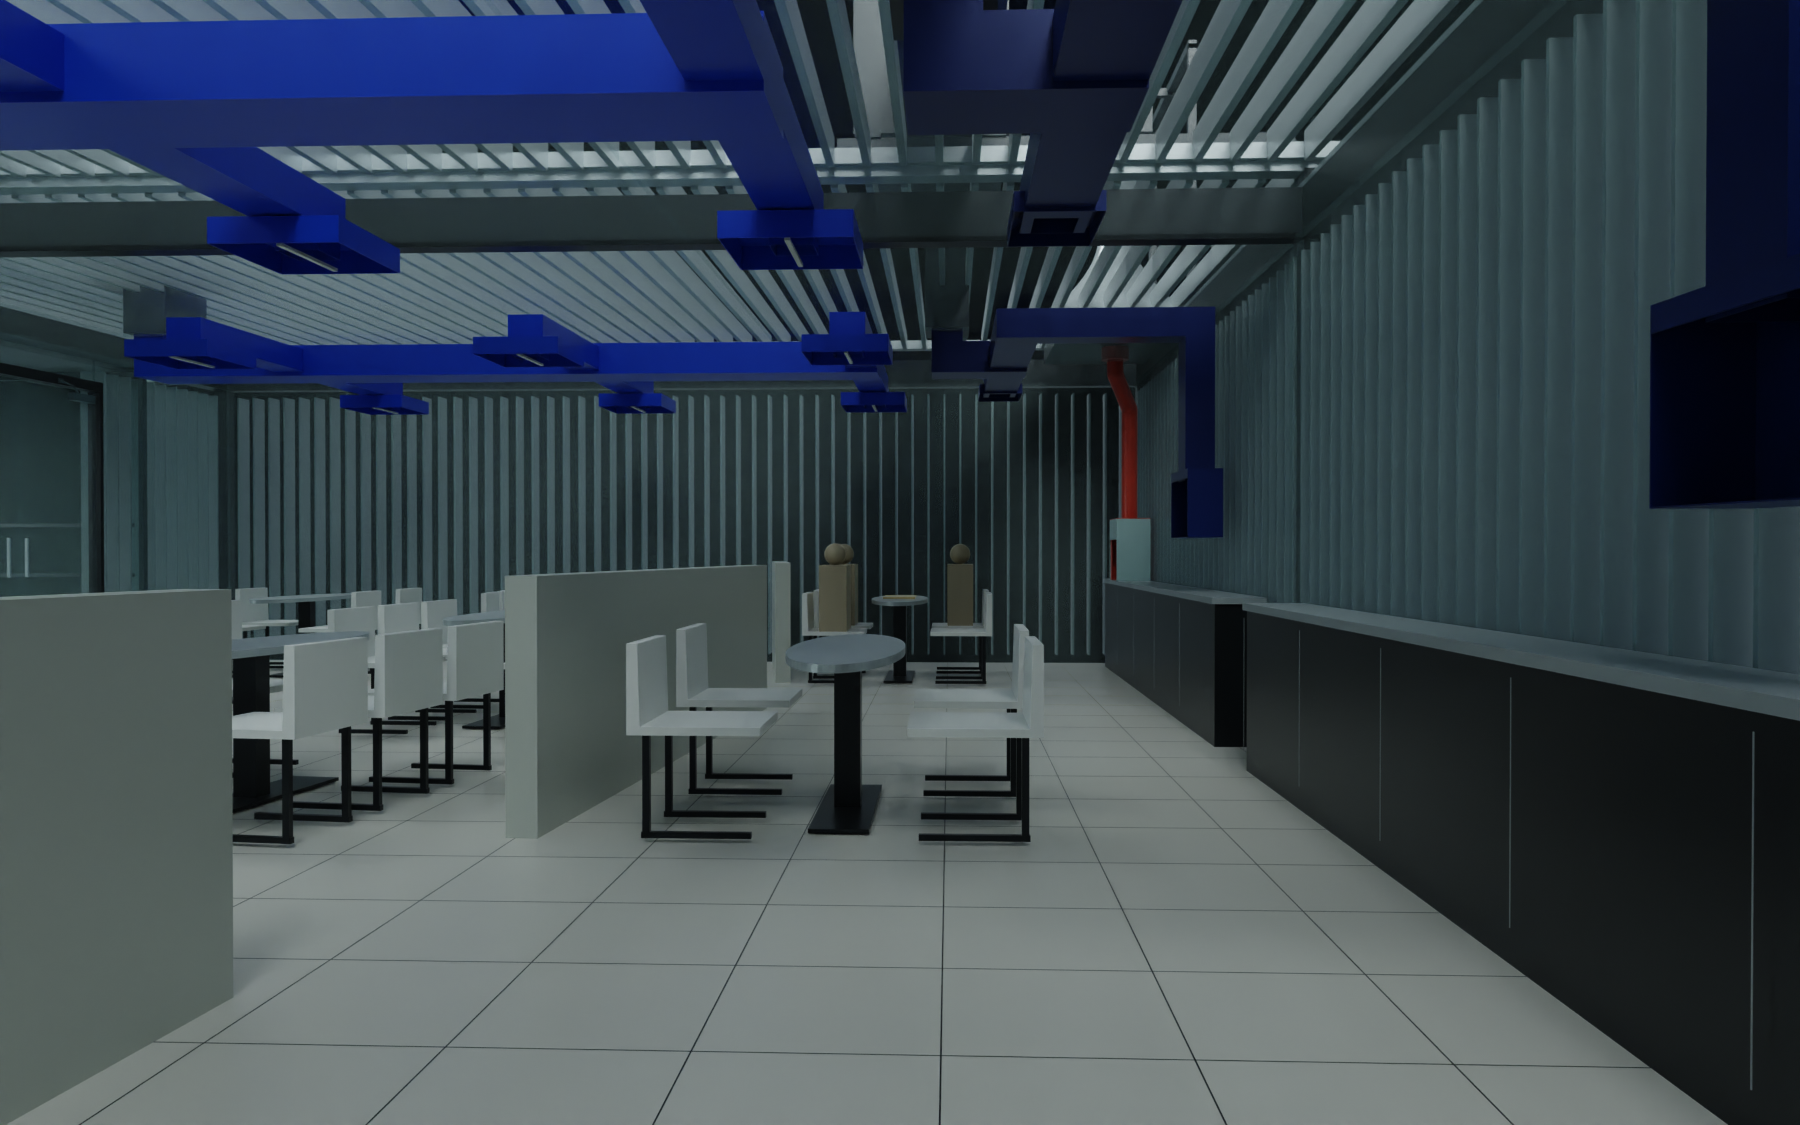
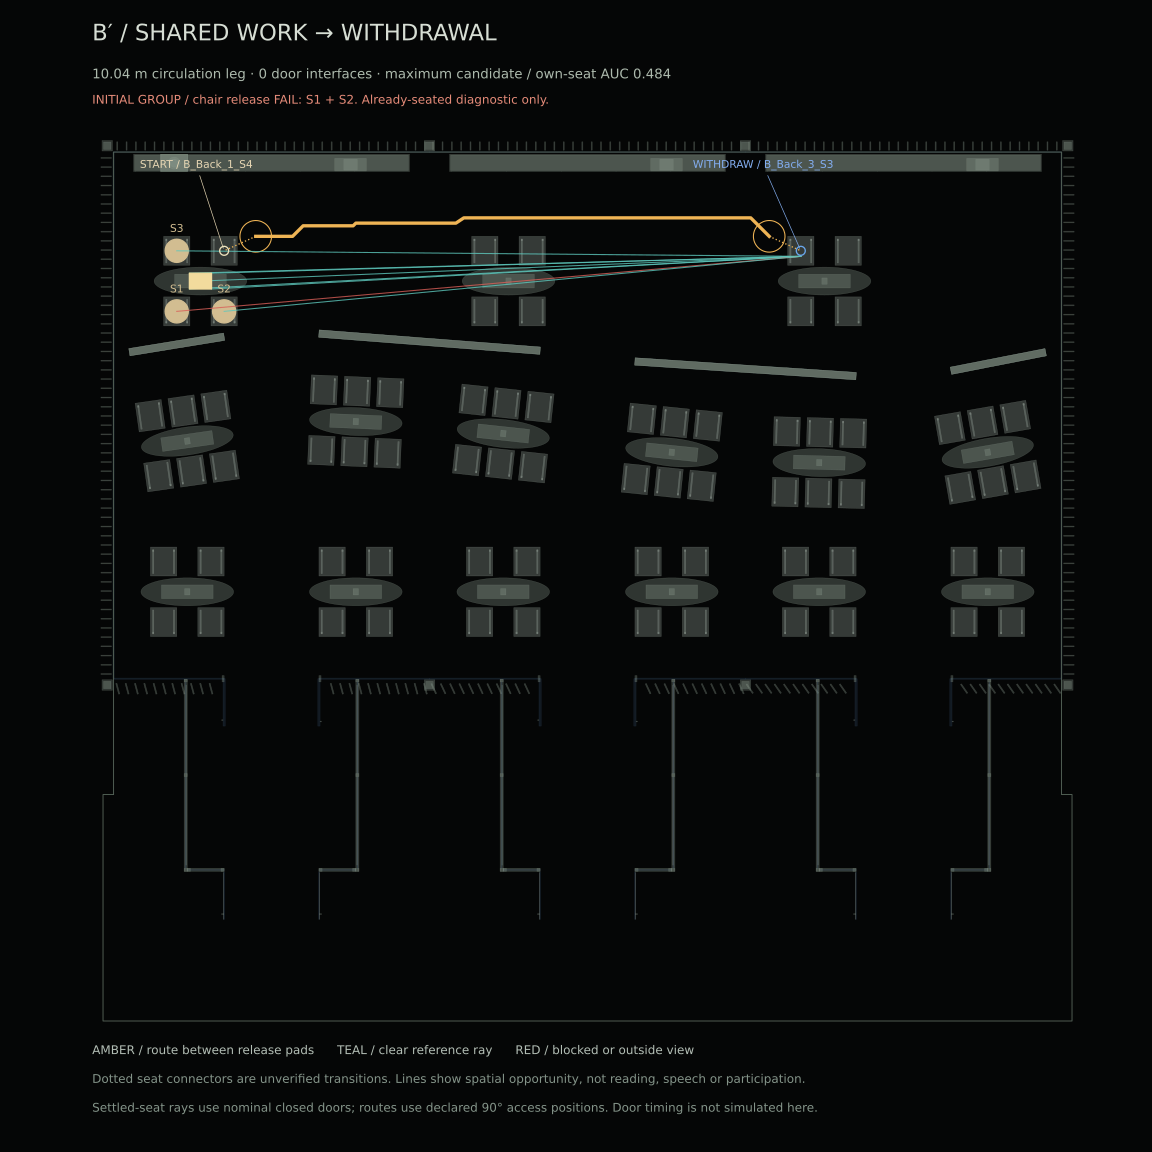
B_Back_1_S4 → B_Back_3_S3 · 10.04 m circulation leg · 0 door interfaces
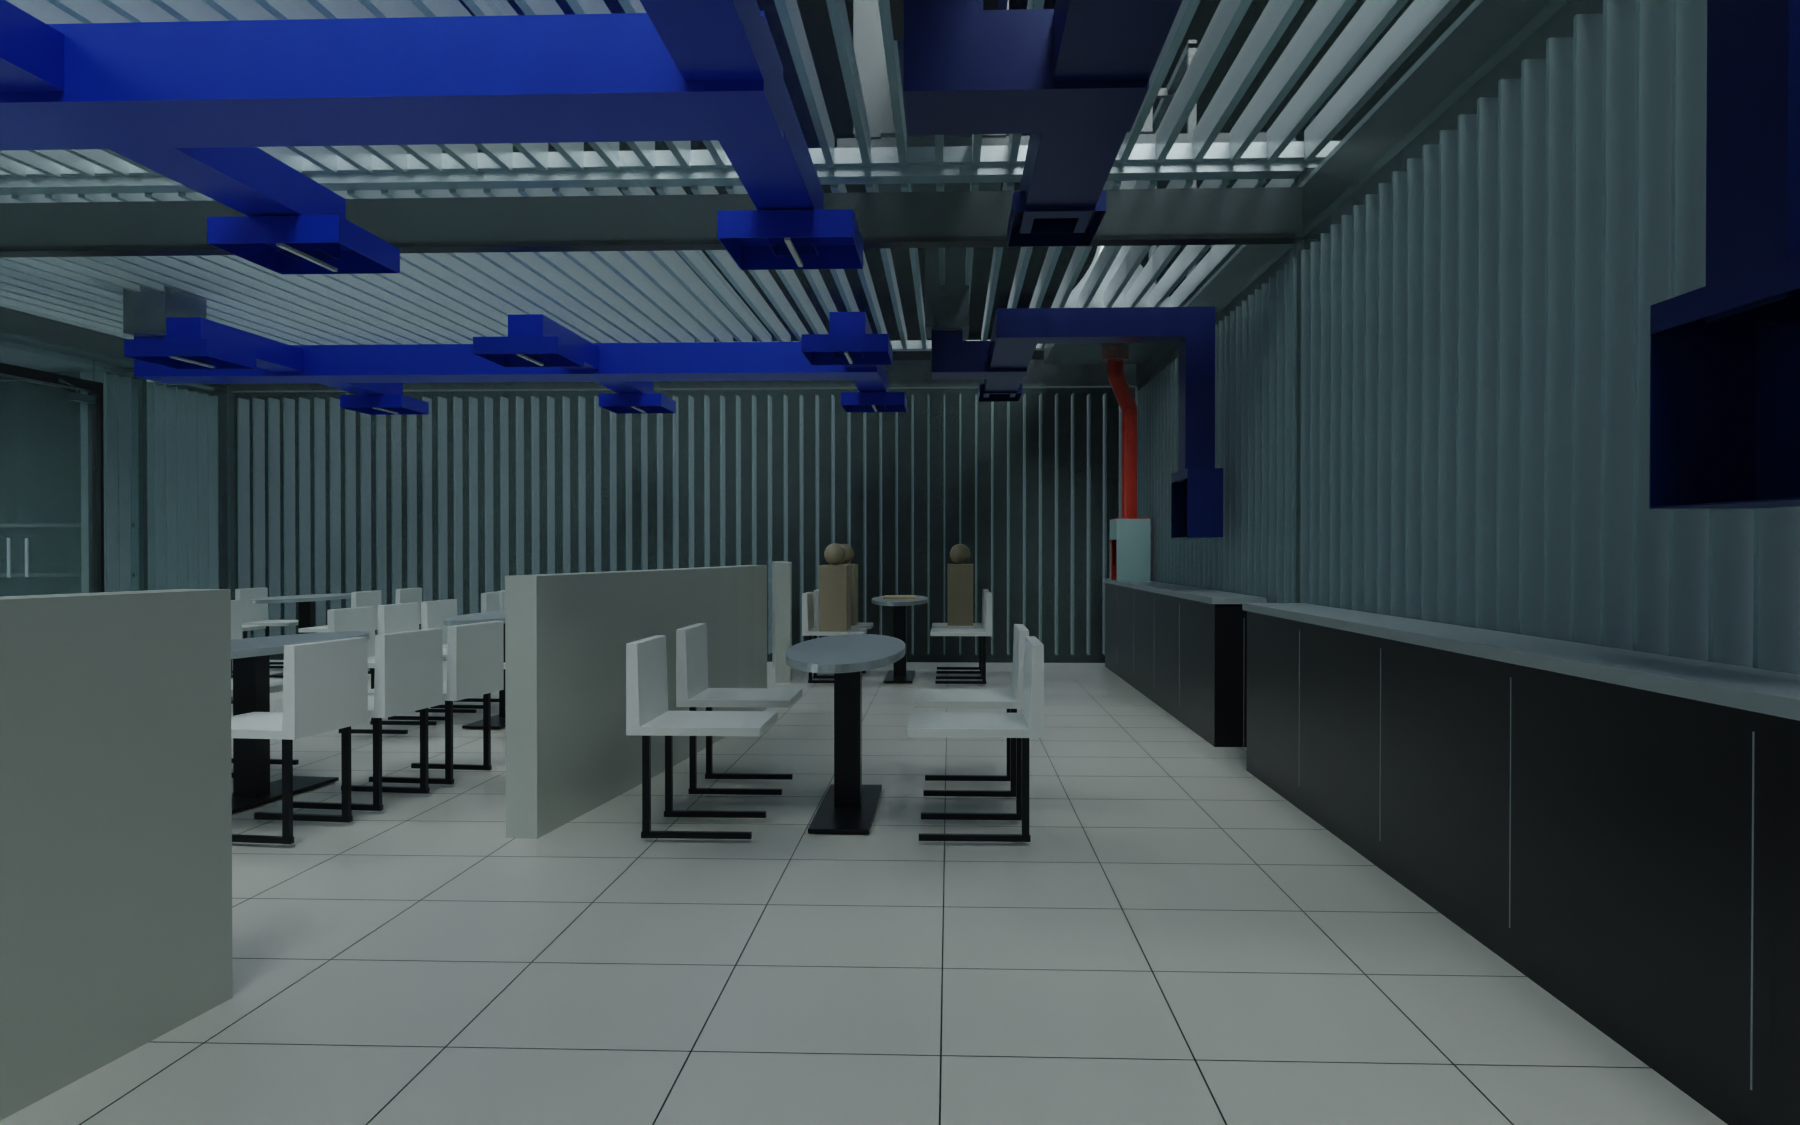
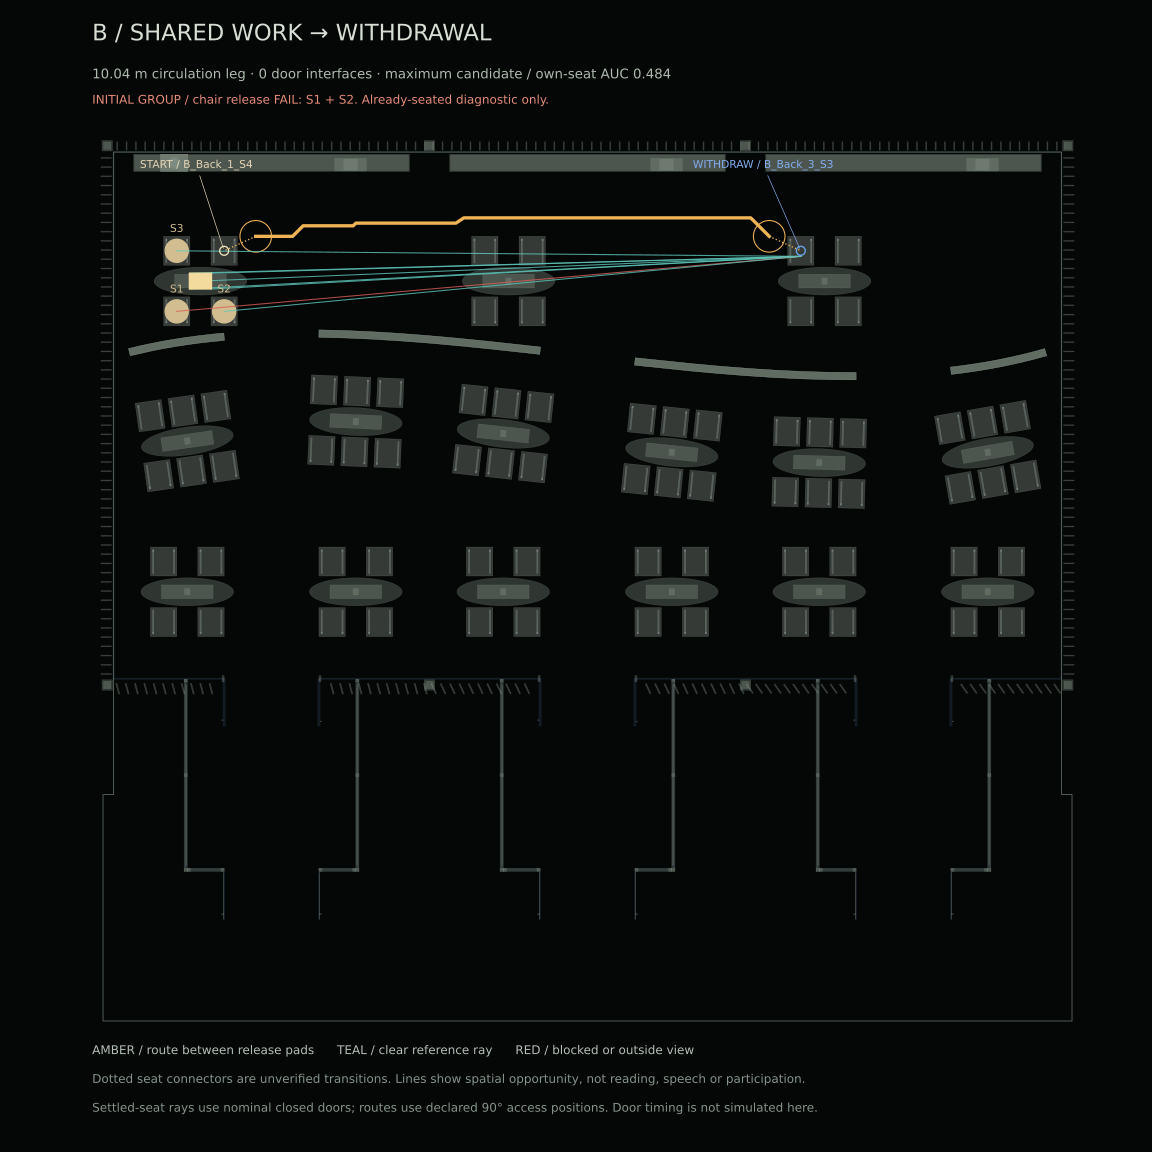
These are failure-diagnosis examples selected by the shortest computed route after exposure and initial vision-only checks; B/B′ also require the board visible. They show a specific tradeoff, not a representative person. These are prior D1 diagnostic views; the continuous reference simulation remains unchanged. D2 architectural views follow below.
Exact selection rules, camera positions and all eight rays ↗This earlier metric uses entry approaches and empty target points. Current occupied withdrawal checks and release pads are reported above.
A loses 28 chairs and gains 7.70 m² of unoccupied floor. For the same 72 retained chairs, all approaches remain reachable. The largest route shortening is about 59 mm, close to the 50 mm grid resolution.
B and B′ both reach 72/72 approach points. Only one route changes by more than 10 mm, and the maximum difference is about 21 mm — below the grid spacing. None of the tested empty-reference or tabletop sightlines changes at the 72 identical positions.
These controls do not establish an advantage for the curved boundary. The curve can still organise the activity row, but that design intention is different from demonstrated performance.
Sightlines test empty reference points above one fixed activity table at 1.05, 1.20 and 1.35 m, and its tabletop. Bodies, posture, face recognition, speech and reading are unmodelled. A different activity position or boundary geometry could produce different results.
Historical baseline: furniture positions and numerical results in this section precede F1b. Use the current entry and return results above for the revised B′/B layout.
This previous stage preceded the occupied route and sightline test above. Its counts and “untested” notes describe that earlier stage. Whole-table means are not the current individual-seat denominator.
PERSONAL REQUIREMENTS / SHARED ACTIVITY / RIGHT TO WITHDRAW
The research question is whether different scent requirements can coexist with shared activity and the option to step back. A higher tracer value is not evidence that someone will like a place.
Scent identity, context, tolerance and the ability to withdraw are separate requirements. The present model contains one assumed source and relative transport. It cannot decide whether a scent is wanted, noticeable or acceptable.
| Alternative | Possible spatial choice | What is given up or remains uncertain |
|---|---|---|
| A72 | Choose among three rooms with different modelled exposure conditions. | Changing room leaves the shared table and requires the front entry/vestibule sequence. Lower remote-room values depend on assumed joint leakage, doors and outside mixing. Contact, route exposure and absence of perceived scent are unverified. |
| B′72 | Choose around a continuous activity row, through common openings and beside low straight boundaries. | Exposure contrast depends strongly on mixing. A seat at another table does not meet a strict same-work-surface requirement. Occupied sightlines, conversation and withdrawal paths need testing. |
| B72 | The same positions and openings as B′, organised by a gently curved boundary. | No resolved scent, approach or sightline advantage over B′. A reason to choose the curve must come from an explicit spatial task or detailing need; construction cost has not been estimated. |
P1 seeks an opportunity to encounter a particular scent; P2 seeks to reduce or avoid perceived scent. Their scent types and acceptable ranges are unknown. No current map establishes either requirement.
All tables have at least four capacity seats. Actual four-person task use is untested. Same-table seat differences are a separate question; they are not included in the different-table screen below.
Moving to another table fails P3’s strict simultaneous requirement. Separate a shared-work phase from a withdrawal phase, or explicitly relax the requirement. Empty sightlines do not demonstrate participation.
These four demands are hypothetical scenarios, not observed behaviour, preferences or satisfaction.
We reused 23 valid saved runs from the connected study, excluding the obsolete rear-return diagnostic. Every activity table was paired with every seat at a different table: 3,240 pairs. The activity baseline is the mean of all available seats at that table, not a particular four-person allocation.
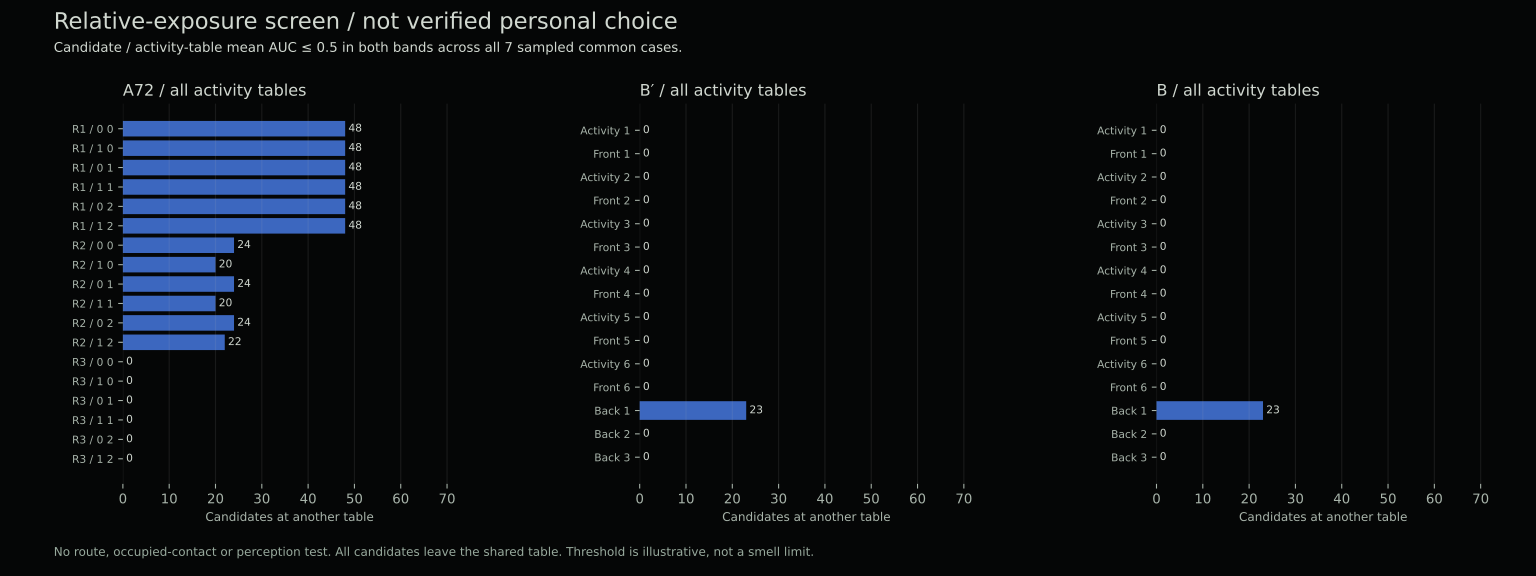
| Illustrative candidate / table AUC ratio | A72 / pairs; tables with a candidate | B′72 / pairs; tables | B72 / pairs; tables |
|---|---|---|---|
| ≤ 0.5 | 422 / 1,224; 12 / 18 | 23 / 1,008; 1 / 15 | 23 / 1,008; 1 / 15 |
| ≤ 0.1 | 288 / 1,224; 6 / 18 | 0 / 1,008; 0 / 15 | 0 / 1,008; 0 / 15 |
| ≤ 0.01 | 144 / 1,224; 6 / 18 | 0 / 1,008; 0 / 15 | 0 / 1,008; 0 / 15 |
Passing requires the ratio to hold in both the lower and middle bands, in all seven sampled common cases: default, low/high mixing, doors held open, no imposed door pumping, imposed outer pressure pattern and finer default grid. This is a selected sensitivity set, not a full factorial or calibrated uncertainty bound. Of A’s 422 half-exposure pairs, 420 also pass the two separate A-only joint-leakage cases. B and B′ have exactly the same all-case passing pair identities at all three thresholds; their 23 half-exposure candidates start at B_Back_1.
These counts are a candidate screen, not a design ranking or a preference success rate.
A higher-exposure starting table can make a relative reduction easier to obtain. A’s default Baseline72-seat middle-band mean (beforeF1b) is 312.40, versus 287.40 / 287.27 in B′ / B. Zero qualifying candidates may mean a table is already in a lower-exposure region; it does not mean the table is unusable. All counted candidates leave the shared table. Walking paths, bodies, contact, absolute concentration and perceived scent remain untested. The three ratios were declared before this screen and are illustrative, not smell or comfort limits.
Native Rhino models are retained privately and are not distributed through this website. The comparison views, setting-out drawings and field documents remain available below.
Current C1 B′/B copies add the nearby full-cycle poses and C1_SETTING_OUT installation lines. They retain all S2 black figures and views. These copies preserve the F1b revision of18 physical furniture objects,72 physical seats, blue D2 ducts and all15 named views. Continuous monochrome black figures replace the earlier S1 silhouettes; the unchanged F1b collision bodies are stored separately. Two S2 orthographic views are added. The previous E1b and MOTION exposure studies are superseded. A72 remains its earlier Motion_D2 copy. The previous supply is hidden, not deleted; D2 outer-envelope meshes are visible. Hidden MOTION_NOT_PHYSICAL sublayers hold initial, departure and first-stop/completed-return body and chair proxies. The private OPTIONS_NOT_PHYSICAL layer stores the P4 contact and P2 exposure studies. The older PARTICIPATION_STUDY_NOT_PHYSICAL layer retains failure-diagnosis examples. Analysis geometry is not installed construction; originals remain preserved.
Original models and research records are preserved. Every control model keeps the same named Rhino cameras. The current route/contact test is above; the bounded full-cycle results are now reported above; untested motion alternatives and service details remain. A larger ML run will not resolve the current geometric and perceptual uncertainties. The connected copies add hidden analysis-interface lines and object metadata; all original physical geometry and named cameras remain intact. These lines are not fabricated openings.